

Gold is rallying following the US midterm elections. A weaker dollar and lower US Treasury yields are supporting the recovery, but a crucial technical hurdle lies just ahead.
The gold price is up around 2.5% at $4,028 per troy ounce on Wednesday morning, 4 November, reclaiming the psychologically important $4,000 level. Attention now turns to the $4,046–$4,073 zone, where the recovery faces its next test: a sustained breakout could strengthen the rebound, while another rejection would leave gold vulnerable to renewed selling.
US midterms: A weaker dollar supports gold
CBS News projects that the Democrats will win control of both the Senate and the House of Representatives. This would significantly constrain President Donald Trump’s ability to pass new legislation. Political gridlock could make additional spending programmes harder to approve, helping to ease pressure on the US bond market. Meanwhile, uncertainty over Trump’s response could support demand for gold as a hedge against political risk.
Gold technical analysis: $4,046–$4,073 is the key zone
Despite the rebound, the broader technical picture remains weak. Gold has lost around 28% since its record high just below $5,600 in late January. Lower highs and lower lows continue to define a downtrend.
The recovery is bringing gold back towards an important resistance zone. The former October 2025 breakout level lies at $4,046, while approximately $4,073 marks the 61.8% Fibonacci retracement of the rally from the May 2025 low to the record high.
A daily close above $4,073 would provide an initial sign of stabilisation. This could bring $4,365 into view, followed by the 200-day moving average near $4,490. A move above the August high at $4,699 would then overcome an important lower high in the downtrend.
If gold fails to reclaim the key resistance zone, attention would return to support at $3,874–$3,894. A break below this area could extend the correction towards $3,641–$3,659, where a prominent chart zone coincides with the 78.6% retracement. Further potential downside levels lie around $3,500 and $3,130.
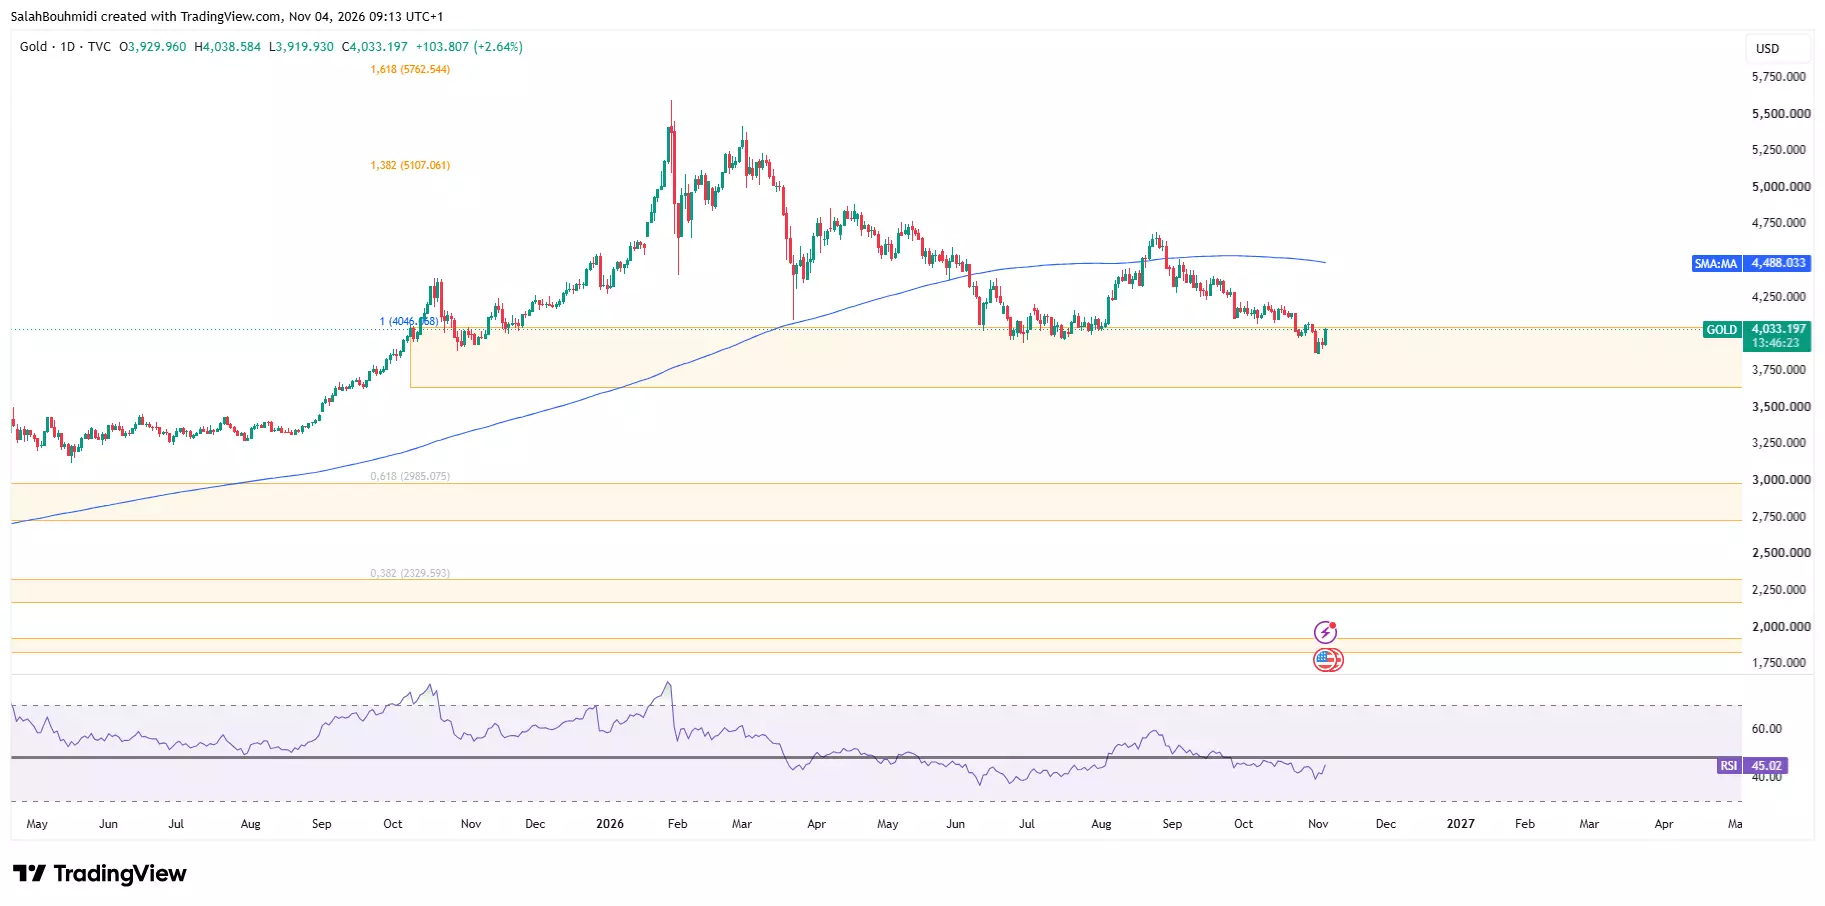
Gold technical analysis: $4,046–$4,073 is the key zoneSource: IG / Tradingview
Gold price: Potential long and short setups
Scenario Confirmation required Potential price targets Invalidated by
Long: Confirmed breakout Daily close above $4,073, followed by a pullback that holds the $4,046–$4,073 zone $4,365, then $4,490 A daily close back below $4,046
Short: Recovery fails Rejection at $4,046–$4,073, followed by a daily close below $4,046 $3,894, then $3,874 A daily close above $4,073
Short: Downtrend continues Daily close below $3,874 $3,641–$3,659, then $3,500 A daily close back above $3,894
Gold outlook: Recovery faces a key resistance test
A weaker dollar and lower Treasury yields are helping gold recover. A more convincing technical improvement, however, requires a sustained move above $4,046–$4,073. Reclaiming this zone would strengthen the case for a broader rebound. Another rejection would leave the recent lows exposed, with a break below them opening the possibility of a correction towards $3,650.
Source: IG.com

