

Gold bounced in August
Gold experienced its strongest month since January (Chart 1). The LBMA Gold Price PM in USD and SHAUPM in RMB rose 13% and 8.4% respectively. Our gold return attribution model identifies momentum as the primary driver of gold’s rebound, underpinned largely by a marked improvement in ETF and futures positioning. Investors ramped up gold buying amid shifting Fed rate expectations and mounting US debt concerns. However, the softer performance of RMB-denominated gold largely reflects an appreciating yuan and weaker domestic investment momentum.
Gold’s momentum weakened in early September as US Fed Chair’s hawkish remarks and strong US labour market data revived investor bets of a Fed rate hike later in the month – though a weaker dollar provided some support.2
Chart 1: Gold’s comeback in August
Monthly returns of gold prices in USD and RMB*
*Data to 31 August 2026. Based on the LBMA Gold Price PM in USD and the Shanghai Benchmark Gold Price PM in RMB.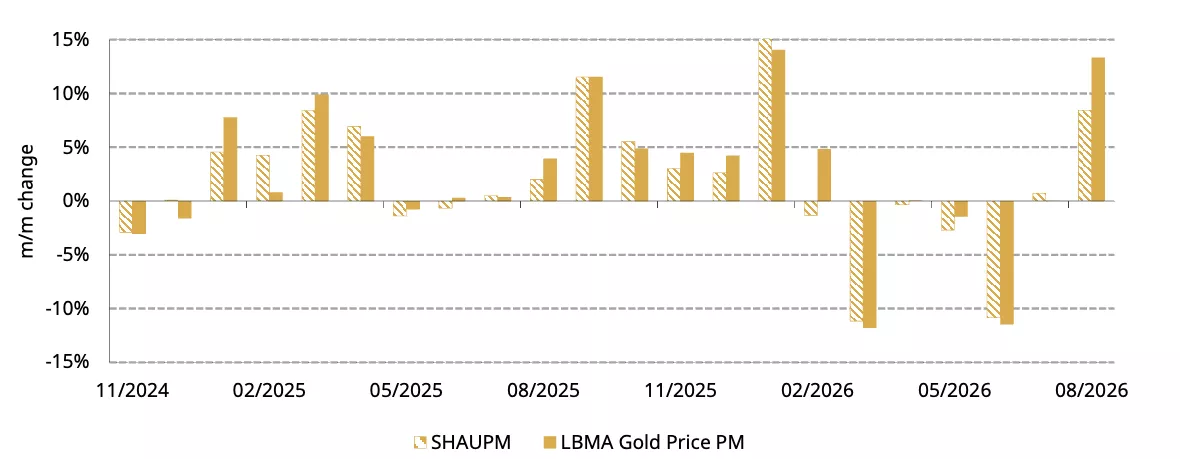
Source: Shanghai Gold Exchange, ICE Benchmark Administration, World Gold Council
Chinese gold ETFs saw continued inflows
Chinese gold ETFs added 11t in August, pushing their collective holdings to 293t (Chart 2). Meanwhile, total AUM climbed RMB10bn (US$1.5bn) to RMB282bn (US$42bn), driven by both the higher gold price and the month’s inflows. A stabilising and rebounding local gold price, alongside further declines in government bond yields, sustained investor interest – as did the PBoC’s continued gold purchase announcements.
Chinese investors continued to buy gold ETFs in early September as local yields kept declining and equities remained sluggish.
Chart 2: Chinese investors continued to add gold ETFs to their portfolios
Chinese gold ETF demand and holdings in tonnes*
*Data to 31 August 2026.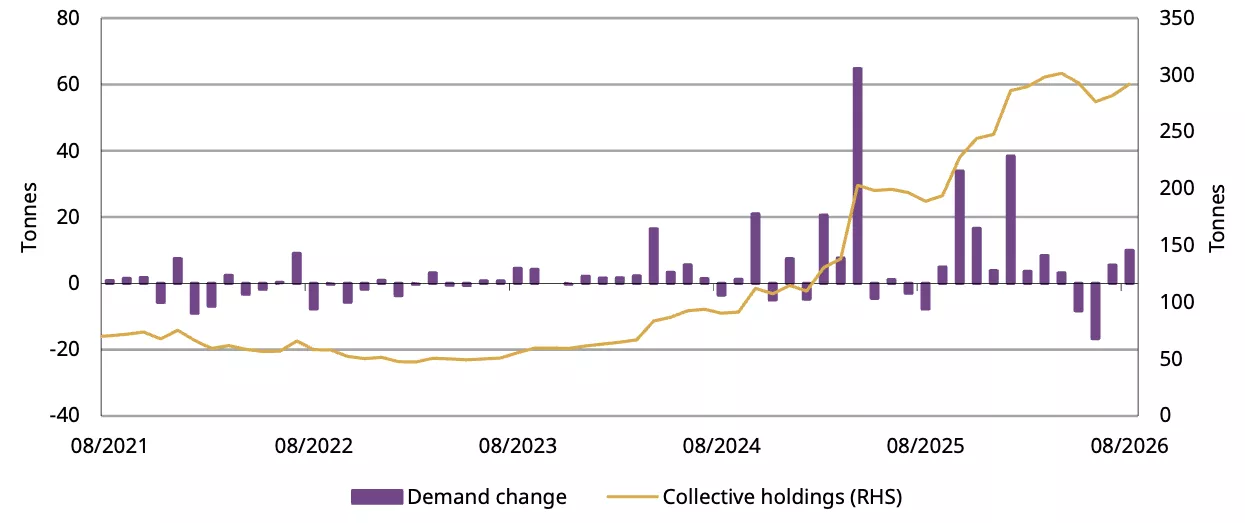
Source: Company filings, World Gold Council
Gold futures volumes and net longs rose in tandem
Gold futures market activity improved in August (Chart 3). The average daily trading volume of gold futures on the SHFE surged 36% m/m to 396t/day. Net longs held by the top 20 market participants – due to data limitation – increased to 154t, up 37t from July. Both reflected improved market sentiment as the gold price rebounded during the month.
Chart 3: SHFE gold futures net longs and volumes both picked up in August
Top 20 net longs of SHFE’s gold futures and average daily trading volumes*
*Data to 31 August 2026.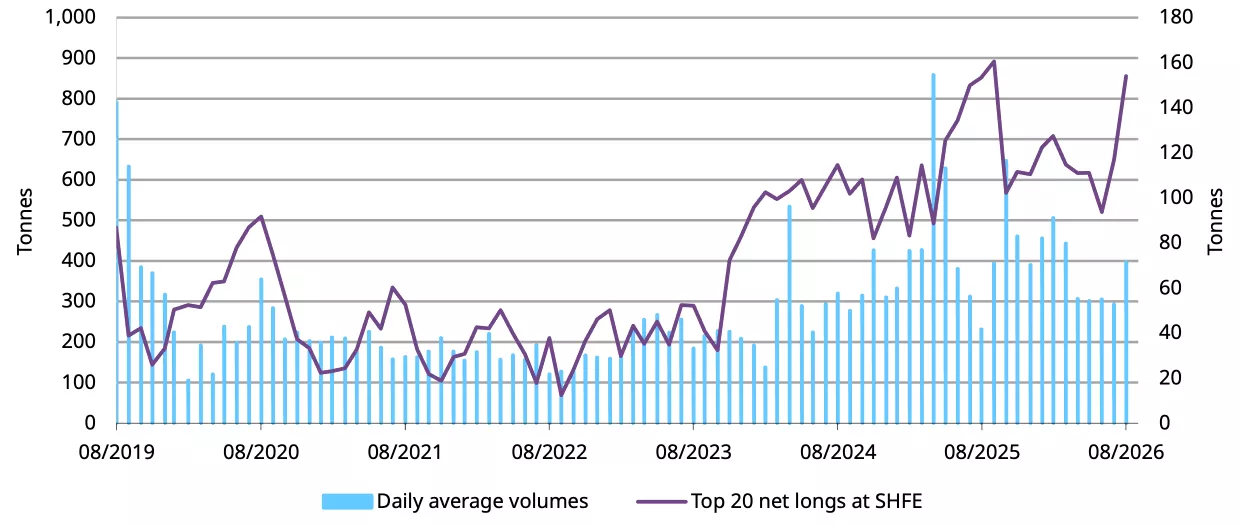
Source: Shanghai Futures Exchange, World Gold Council
August gold withdrawals from the SGE slid further
Gold withdrawals from the SGE contracted 22% m/m and 27% y/y to 62t in August (Chart 4). This unseasonal wholesale demand fall is mainly a result of cooling momentum in bullion investment and still tepid gold jewellery demand overall. Although gold ended August higher, some longer-term physical gold investors chose to wait on the sidelines for a clearer price uptrend while some continued to look for a better entry point.
Jewellery wholesale demand stayed tepid y/y as a notably higher price and the additional VAT burden compared to last year kept weighing on consumption. Nonetheless, there was a slight upturn in restocking by jewellery manufacturers as they prepared for new product launch events, which usually occur in September. Anecdotal evidence suggests that manufacturers increased replenishment earlier in August when the gold price started to rally. But as gold’s volatility rose later in the month, they stayed cautious. Meanwhile, the lightweight product trend continued to contribute to a reduction in the jewellery sector’s tonnage wholesale demand.
Chart 4: Wholesale demand softened unseasonally in August
Gold withdrawals from the SGE by month and the ten-year monthly average*
*As of 31 August 2026. Ten-year average based on data between 2016 and 2025.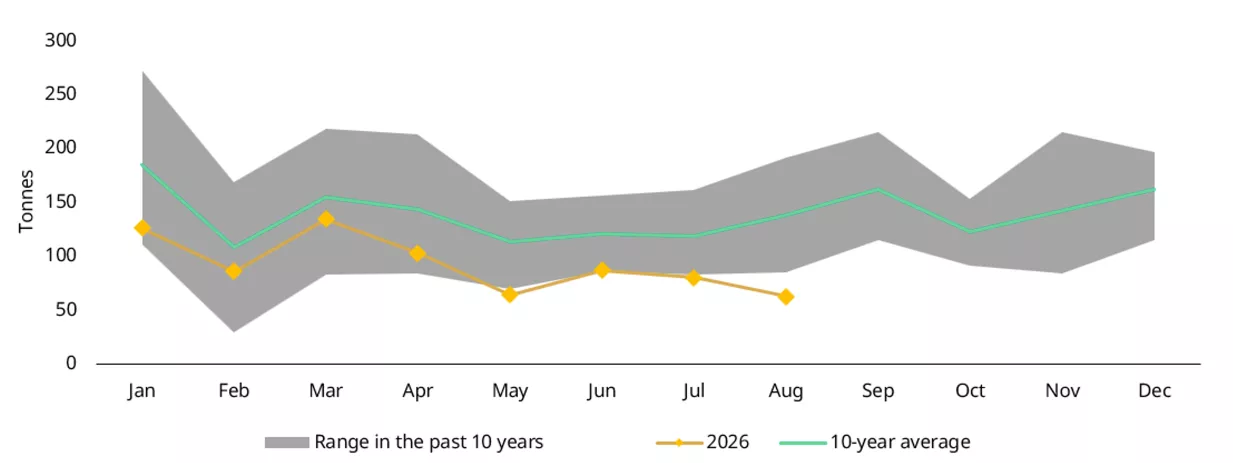
Source: Shanghai Gold Exchange, World Gold Council
The PBoC accelerated gold accumulation
The PBoC reported a 20.2t gold reserve addition in August, the largest monthly increase since October 2023 (Chart 5). Official gold holdings have now risen for 22 consecutive months, reaching 2,387t by the end of August and accounting for 9% of total foreign exchange reserves, up from 8% in July. This underscores the central bank’s commitment to strengthening reserve diversification and resilience in an increasingly uncertain geopolitical environment.
Chart 5: The PBoC extended its gold purchasing streak to 22 months
The PBoC’s reported gold purchases and the gold price*
*Data to 31 August 2026.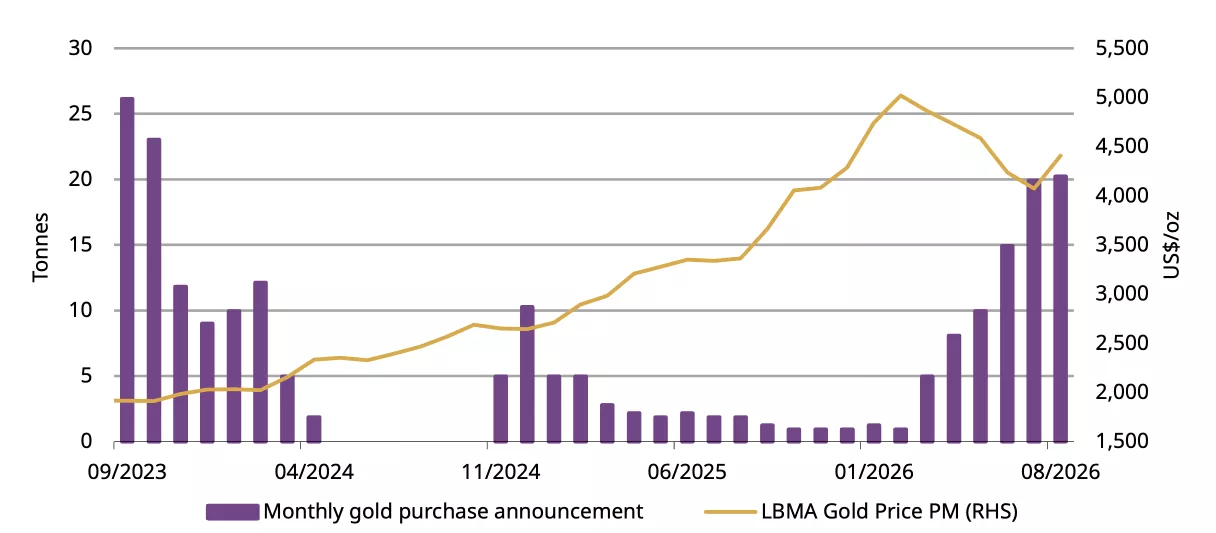
Source: State Administration of Foreign Exchanges, World Gold Council
Imports moderated in July
China’s 118t net gold imports in July represent a 34t contraction from June (Chart 6). The m/m decline was largely due to softer wholesale demand in the month. And on a y/y basis, there was a 34% rise – we believe a higher local gold price premium in July compared to last year and strong gold bullion demand momentum, despite jewellery weakness, contributed to the y/y improvement in imports.
Chart 6: Gold imports moderated in July
Net gold imports under HS7108*
*Data to July 2026.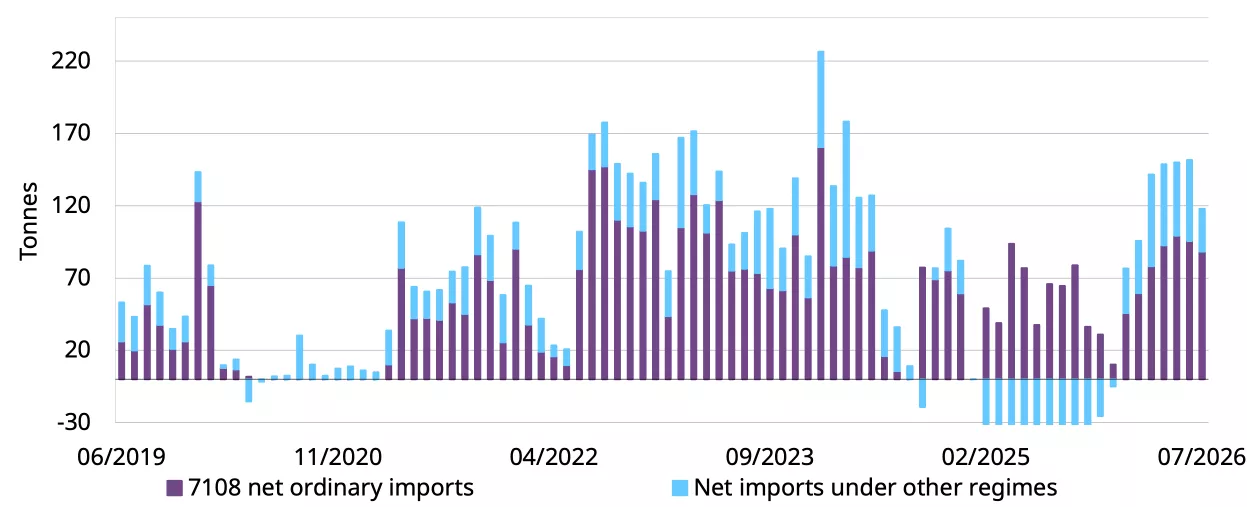
Source: China Customs, World Gold Council

