

For most of American history, prices barely moved. Between 1800 and 1940, U.S. prices rose by an average of about 0.2% a year, and the cost of living on the eve of World War II was only modestly higher than it had been 140 years earlier. The economy went through nearly 70 separate episodes of deflation, including a decline of around 40% in the decades after the Panic of 1873.
Inflationary booms happened, usually during wars, but deflationary busts reliably followed and wiped them out. After 1940, that balance disappeared. Prices began rising and never meaningfully came back down.
This wasn’t an accident. It was the result of monetary policy decisions made over roughly six decades that changed what money is, who controls it, and what those controllers aim for. Those decisions explain why a dollar today buys a small fraction of what it did in 1940.
The old system: money tied to metal
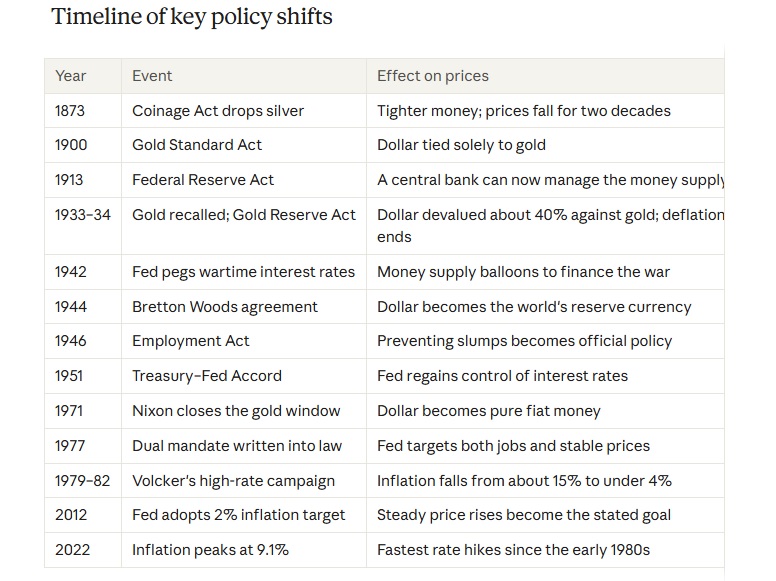
Throughout the 19th century, the dollar was anchored to precious metals. Early on, the country ran a bimetallic system backed by both gold and silver. The Coinage Act of 1873 effectively dropped silver, and the Gold Standard Act of 1900 made gold the sole standard.
This tied the money supply to the nation’s gold stock. When the economy grew faster than gold was mined, there wasn’t enough money to go around, and prices fell. That is a big reason the late 19th century was so deflationary: industrial output boomed while gold lagged. The squeeze fueled the “free silver” fight of the 1890s, as indebted farmers demanded more money in circulation to lift crop prices.
The gold standard didn’t prevent inflation entirely. The Union printed unbacked “greenbacks” to fund the Civil War, and prices surged. But the push to restore gold convertibility after the war forced prices back down. Gold acted as a long-run anchor, pulling prices back toward where they started.
The country also lacked a central bank. After the Second Bank of the United States lost its charter in 1836, no institution managed the money supply or acted as lender of last resort. Panics were frequent, and when banks failed, the money supply contracted and prices fell further.
1913: the Federal Reserve arrives
The Panic of 1907 convinced Congress the banking system needed a backstop. The Federal Reserve Act, signed in December 1913, created a central bank designed to supply an “elastic currency” that could expand when the economy needed it.
The early Fed still operated within the gold standard, so its power to create money was limited. But for the first time, a central body could deliberately influence the money supply and interest rates. World War I showed what that meant: prices roughly doubled between 1914 and 1920, then fell sharply in 1920–21 as the system snapped back toward its gold anchor.
1933–34: breaking the domestic link to gold
The Great Depression exposed the gold standard’s greatest weakness. As banks collapsed, the money supply shrank by about a third and prices fell by roughly a quarter. Gold constraints kept the Fed from responding aggressively, and countries that stayed on gold longest tended to suffer the deepest downturns.
Franklin Roosevelt moved decisively. A 1933 executive order required Americans to turn in most gold coins and bullion. The Gold Reserve Act of 1934 raised the official gold price from $20.67 an ounce to $35, devaluing the dollar by about 40% against gold. Private citizens could no longer redeem dollars for gold.
Domestically, the dollar was no longer a claim on metal. The government had shown that money’s value could be changed by policy. Prices began recovering in the mid-1930s, and the long era of deflation was effectively over.
World War II and the pegged bond market
During World War II, the Fed committed to keeping government borrowing cheap. It pegged Treasury bill rates very low and capped long-term bond yields at around 2.5%. Holding those rates meant buying whatever bonds the market didn’t want, which meant creating money on demand.
Monetary policy became subordinate to the Treasury’s financing needs, and the money supply ballooned. Price controls held inflation down temporarily, but prices jumped sharply once controls lifted in 1946 and 1947.
Unlike after every previous war, there was no deflationary snapback. The gold anchor no longer operated domestically, and the government had no appetite for the painful contraction needed to return to prewar prices.
1944–1946: a new international order and a new mandate
Two developments at the war’s end locked in the new regime.
The first was the Bretton Woods agreement of 1944. Other currencies were pegged to the dollar, and the dollar was convertible to gold at $35 an ounce, but only for foreign governments and central banks. This kept a thin international link to gold while freeing domestic policy from it. As the world’s reserve currency, the dollar enjoyed steady global demand, giving the U.S. room to expand its money supply.
The second was the Employment Act of 1946, which made the federal government responsible for promoting maximum employment, production and purchasing power. Before the war, slumps were largely endured. Afterward, preventing them became an explicit policy goal, shaped by John Maynard Keynes’s argument that governments should actively manage demand. A regime built to prevent downturns will, almost by design, lean toward too much money rather than too little.
1951: the Fed regains its independence
The wartime bond peg lasted into the postwar years. When the Korean War pushed inflation up again, the Fed pushed back. The Treasury–Federal Reserve Accord of 1951 ended the peg and restored the Fed’s ability to set policy independently of government borrowing needs.
The 1950s and early 1960s brought relatively low, stable inflation, typically in the low single digits. But “low” was now the goal, not zero. Mild, steady price increases had become the accepted norm, and no one was trying to reverse them.
1971: the end of gold
Through the 1960s, Bretton Woods came under growing strain. The U.S. ran large deficits to fund the Vietnam War and new domestic programs, and the Fed kept policy loose. Dollars piled up overseas, foreign governments doubted the U.S. could honor gold conversion at $35 an ounce, and American gold reserves dwindled as some cashed in.
On August 15, 1971, President Richard Nixon suspended the dollar’s convertibility into gold. Presented as temporary, it proved permanent. By 1973 the major currencies were floating, and Bretton Woods was over.
The dollar became a pure fiat currency, backed only by the government’s authority and public trust. No physical constraint remained on how much money could be created. The supply of dollars now depended entirely on Federal Reserve decisions.
The Great Inflation
Freed from gold and under political pressure to keep unemployment low, the Fed let monetary conditions stay too loose through the 1970s. Oil shocks in 1973 and 1979 added fuel. Inflation hit double digits in the mid-1970s and peaked near 15% in early 1980.
Expectations came unanchored. Workers demanded bigger raises because they expected higher prices, businesses raised prices because they expected higher costs, and the cycle fed itself.
In 1977, Congress amended the Federal Reserve Act to give the Fed its “dual mandate”: maximum employment and stable prices. The Humphrey-Hawkins Act of 1978 reinforced it. The Fed now had two goals that could pull in opposite directions.
Volcker and the discipline of high rates
Paul Volcker, appointed Fed chair in 1979, broke the spiral by letting interest rates climb to extraordinary levels, with the federal funds rate approaching 20% in 1981. The result was a severe recession and unemployment above 10%, but inflation fell to around 3–4% by the mid-1980s.
Volcker established that a credible, independent central bank could control inflation. But the goal was to keep inflation low, not to eliminate it, and certainly not to reverse past increases.
The 2% target: inflation made official
Through the 1990s and 2000s, inflation settled into roughly 2–3% a year, a period often called the Great Moderation. In January 2012, under Chair Ben Bernanke, the Fed formally adopted a 2% annual inflation target, following several other central banks.
This made explicit what had been true since the 1940s: official policy is for prices to rise steadily every year. At 2% a year, prices double roughly every 35 years.
The reasoning is that mild inflation buffers against deflation, which central bankers see as far more dangerous because it can trap an economy in falling spending and rising real debt burdens. It also leaves room to cut rates in a downturn and makes it easier for wages to adjust.
Crisis-era tools and the return of high inflation
After the 2008 financial crisis, the Fed cut rates to near zero and launched quantitative easing, buying trillions of dollars of government bonds and mortgage securities. Its balance sheet grew from under $1 trillion to about $4.5 trillion. Surprisingly to many, inflation stayed subdued for years.
The COVID-19 pandemic changed that. In 2020 the Fed again cut rates to zero and grew its balance sheet to nearly $9 trillion, while Congress passed trillions in fiscal relief. The Fed also adopted “flexible average inflation targeting,” signaling it would tolerate inflation above 2% for a while.
Combined with supply-chain disruptions and surging demand, the result was the highest inflation in four decades, peaking at 9.1% in June 2022. The Fed responded with its fastest rate hikes since the Volcker era.
Why prices only go up now
Four changes explain the shift from the flat prices of the 19th century to the steady rise of the modern era:
- The gold anchor is gone. Loosened in 1933, weakened in 1944 and removed in 1971, it no longer drags prices back down after booms. Money has no physical limit.
- A central bank manages money with employment in mind. That biases policy toward stimulus in downturns.
- Deflation is treated as a danger to avoid. The busts that once offset inflationary booms are no longer allowed to happen.
- Steady inflation is the formal target. Since 2012 it has been the stated goal, not a side effect.
Each step answered a real problem: bank panics, the Depression, wartime financing, currency crises, runaway inflation. The modern system has made severe depressions and deflationary collapses far rarer. The trade-off is continuous erosion of purchasing power: a 1940 dollar bought what roughly $20 or more buys today.
What it means for ordinary people
Under the gold-based system, money saved in 1800 held most of its value into the 20th century. Under the modern system, cash steadily loses ground, and it is designed to. Saving alone is no longer enough, which is why assets that tend to outpace inflation, such as stocks, real estate and inflation-protected bonds, have become central to building wealth.
Inflation feels permanent. In reality, it’s a policy choice less than a century old, and one every saver now has to plan around.
Note on figures
The 1800–1940 figures come from the source passage. Later dates and figures are approximate, drawn from widely reported historical data, and should be checked against the Bureau of Labor Statistics or the Federal Reserve before publishing.
Sources:
Ben Carlson, The Biggest Risk to the Economy, A Wealth of Common Sense, September 2026 — the 1800–1940 inflation, deflation and Long Depression figures.
- Federal Reserve Bank of St. Louis, A Short History of Prices, Inflation Since the Founding of the U.S., 2017 — long-run averages before and after the Fed.
- Federal Reserve History, Federal Reserve Act Signed into Law — the Panic of 1907 and the 1913 Act.
- Federal Reserve History, Gold Reserve Act of 1934 — Roosevelt’s gold program and the $35 gold price.
- FRASER, Treasury-Federal Reserve Accord of 1951 timeline — the wartime rate peg.
- Federal Reserve History, Creation of the Bretton Woods System — the 1944 agreement.
- Federal Reserve History, WWII and Its Aftermath — the Employment Act of 1946.
- Federal Reserve History, The Treasury-Fed Accord — Fed independence in 1951.
- Federal Reserve History, Nixon Ends Convertibility of U.S. Dollars to Gold — the August 1971 decision.
- Federal Reserve History, The Great Inflation — 1965–1982 and the March 1980 peak.
- Federal Reserve Board, FOMC statement of longer-run goals and policy strategy, January 25, 2012 — the 2% target.
- U.S. Bureau of Labor Statistics, Consumer prices up 9.1 percent over the year ended June 2022 — the 2022 peak.
The Volcker-era rate levels and Fed balance-sheet totals are approximate and not yet tied to a source above.
Disclaimer: This article is for general informational and educational purposes only. It is not financial, investment, tax or legal advice, and nothing in it is a recommendation to buy, sell or hold any asset.
Historical figures are drawn from the sources listed above and may be rounded or approximate. Past inflation and market performance do not guarantee future results. Readers should verify key figures against original sources and consult a qualified financial professional before making decisions based on this material. Views expressed are the author’s own and do not represent those of any organization cited.

