Over the past 100 years, the gold-to-silver ratio the number of ounces of silver needed to buy one ounce of gold has averaged roughly 50 to 65, with most of its time spent between about 30 and 100, though the long-run mean has drifted higher in recent decades toward the mid-60s.
After silver’s progressive demonetization early in the 20th century, the ratio expanded and became more volatile; it reached highs near 100 during the late 1930s and early 1940s amid the Great Depression and World War II, briefly compressed to the mid-teens in 1968 and again to about 17 in early 1980 during the Hunt Brothers’ silver squeeze, then climbed back toward 100 in 1991.
In the free-floating era after 1971 the average settled near 60–65, with notable extremes including a trough around 32 in 2011 and a modern-record peak above 120–125 in March 2020 when COVID-driven safe-haven demand favored gold while silver (with its large industrial component) fell sharply.
Overall the ratio has shown a structural upward bias as gold retained a stronger monetary premium relative to silver’s more industrial demand profile, though it remains mean-reverting over long periods and continues to serve as a relative-value gauge for investors.
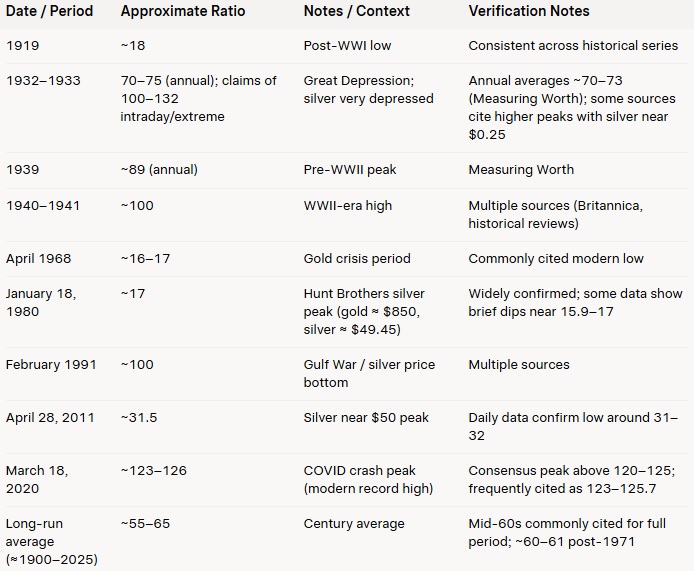
Sources: Cheched
1980 low (~17): Confirmed by contemporaneous prices (gold near its then-record $850 and silver near $49–50).
2020 high (~123–126): Confirmed by multiple market reports; silver briefly traded near or below $12 while gold held relatively better.
2011 low (~31–32): Confirmed by daily ratio tables.
1930s–1940s highs (~100): Supported by annual data and historical reviews; extreme claims of 130+ in 1933 appear in some secondary sources but are less consistently verified in primary annual series.
Averages of 50–65 over the century and ~60 since free-floating prices began in 1971 are consistent across sources.