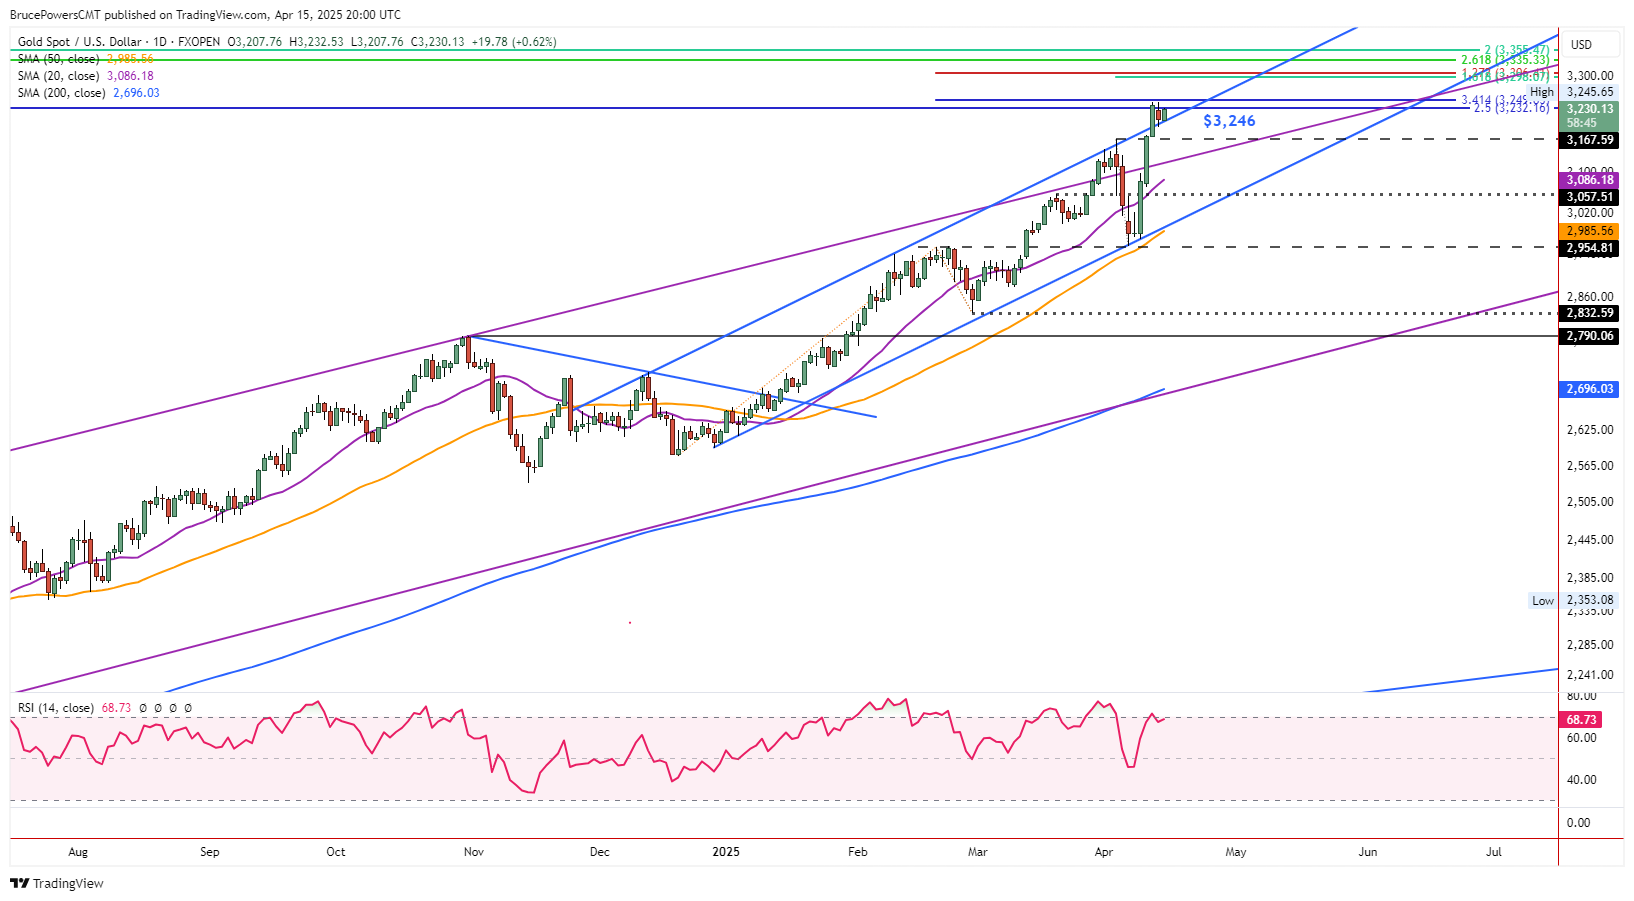
Gold retained a bullish posture on Tuesday as it consolidated within Monday’s price range with a high of $3,233 and a low of $3,208. Monday’s high reached a new record high of $3,246, which was only slightly above last week’s high of $3,245. Notice that support was seen today and yesterday at a top trend channel line (blue). A breakout of the channel triggered on Friday, and it was confirmed by both a daily and weekly close above the line.
Earlier last week there was a confirmed breakout above a larger trend channel that is marked with purple lines. The confirmed breakouts of the channels showed strength in demand for gold, while the subsequent test of the top line, which previously represented resistance, is another step towards the potential continuation of the bull trend.
Experts trade the markets with IC Markets
Trading Derivatives carries a high level of risk to your capital and you should only trade with money you can afford to lose. Trading Derivatives may not be suitable for all investors, so please ensure that you fully understand the risks involved, and seek independent advice if necessary.
Short-term Weakness Below $3,194
Nonetheless, a drop below today’s low will show short-term weakness and further still on a decline below Monday’s low of $3,194. However, Fridays low of $3,173 is a better judge of support for the three-day price range. And it can be considered along with the April 3 high of $3,168. That was the most recent trend bull breakout level. Both the top purple channel line and the 20-Day MA, now at $3,086, are key potential support areas to watch.
Higher Targets Start at $3,298
On the upside, a decisive breakout above $3,246 has gold heading towards higher potential targets. First, there is a price zone from $3,298 to $3,306, identified from relatively short-term Fibonacci measurements. Subsequently, there are two higher targets at $3,335 and $3,355. The first higher target is a 261.8% extension of the decline from the 2011 peak. Given its very long-term nature, that price level may have greater significance. The next price level is a 200% extended target from a rising ABCD pattern that begins from the August 2018 low.
Bullish Engulfing Pattern on Weekly Chart
There is also a bullish pattern on the weekly chart (not shown) as last week completed a bullish engulfing candlestick pattern with a new record high closing price. Given the reaction so far this week, the bulls remain in charge. Confirmed breakouts of two rising channels provide a similar bullish assessment of current demand.
Source: Fxempire