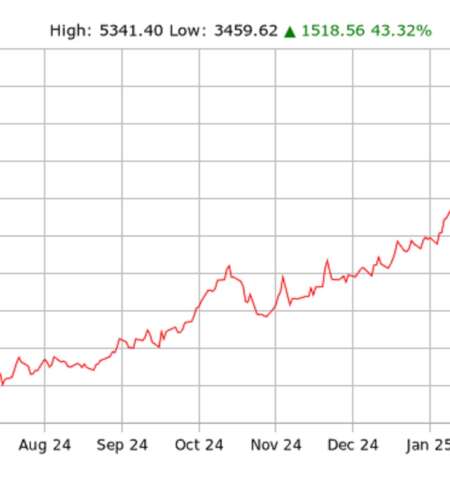
Gold markets have gone back and forth a little bit in the early hours of Monday as we continue to hang around the $2,900 level. That being said, you should also start to look at the chart through the prism of whether or not we are forming a bullish flag. It does look like a bullish flag at least so far, and therefore I think a lot of buyers will continue to be attracted to this market.
Even if we pull back, the market is likely to continue to see the 50-day EMA below as significant support as it is right at the bottom of the flag near the $2,820 level. Short-term pullbacks should be buying opportunities in gold, which of course has done quite well for quite some time. And this little bit of consolidation does make a certain amount of sense, considering that we have to digest those gains.
Experts trade the markets with IC Markets
Trading Derivatives carries a high level of risk to your capital and you should only trade with money you can afford to lose. Trading Derivatives may not be suitable for all investors, so please ensure that you fully understand the risks involved, and seek independent advice if necessary. A Product Disclosure Statement (PDS) can be obtained either from this website or on request from our offices and should be considered before entering into a transaction with us. Raw Spread accounts offer spread
If the market were to break higher and maybe above the $2,950 level, then that kicks off the bullish flag thesis and it could open up a move all the way to the $3,300 level before it’s all said and done. I would expect the $3,000 level to offer a little bit of resistance though, I don’t think we just slice through there without options traders having their say.
In general, though, the best way to look at this chart is that gold’s in a significant uptrend and gold has been in a significant uptrend for some time. So therefore, there’s no need to fight. I like buying only, not selling, and I like buying on dips even more than buying here.
Source: Christopher Lewis FXempire