Gold has long been a safe-haven asset, but recent price action suggests we may be entering one of the most significant bull markets in modern history. Analysts now project gold could reach $5,000–$6,000 by 2027, supported by a mix of technical patterns, historical analogues, and strong macroeconomic drivers. For investors, the current correction phase presents a potential entry point ahead of the next powerful upward move.
Gold’s Historical Breakout Patterns
Gold’s trading history shows a remarkably consistent cycle after major breakouts:
-
Strong initial surge – Prices accelerate rapidly once resistance is broken.
-
Correction phase – A pullback typically lasting 4–5 months, resetting momentum.
-
Test of the 200-day moving average – Often within 2–3% of price action.
-
Renewed bull phase – Stronger momentum builds, setting higher highs.
This pattern has repeated throughout modern gold history, providing investors with a roadmap for the current cycle.
Three Key Breakouts That Define Today’s Market
-
1972 Breakout – Triggered when Nixon ended the Bretton Woods gold standard, unleashing true price discovery.
-
2005 Breakout – Emerged from a 23-year base, fuelling a run toward $1,900 by 2011.
-
2023–2024 Breakout – Considered the second most significant, breaking free from a 13-year consolidation after the 2011 peak.
The current breakout mirrors the structure of the 1970s and mid-2000s, both of which led to extraordinary price gains.
Where Gold Stands Now
Gold is now in a correction phase following the 2023–2024 breakout. Technical indicators suggest the market is around four months into this phase, with signs pointing towards a bottom forming in the coming 1–2 months.
-
The 200-day moving average continues trending upward, acting as strong support.
-
Volume patterns suggest distribution is nearly complete.
-
Momentum indicators are softening, hinting that downside pressure is waning.
-
Investor sentiment is increasingly pessimistic – a classic contrarian buy signal.
Analysts estimate the correction could bottom around $3,100, creating what may be the optimal buying opportunity before the next major bull run.
Gold Price Targets Through 2027
Conservative Projection ($5,000 by 2026)
Based on the 2005–2006 cycle, gold could climb steadily to $5,000 by late 2026 – a 60% gain from current levels.
Moderate Projection ($5,800–$6,000 by 2027)
Averaging multiple breakout patterns suggests gold could rise 90–100%, reaching $5,800–$6,000 by early 2027.
Aggressive Projection ($6,500+ by 2027)
If conditions mirror the 1970s, persistent inflation and weakening fiat currencies could send gold to $6,500–$6,800 within 24 months.
The Drivers Behind Gold’s Next Bull Market
Macroeconomic Forces
- Central bank buying – Record global purchases, with 1,136 tonnes added in 2022 alone.
-
Real interest rates – Still accommodative for gold despite higher nominal rates.
-
De-dollarisation – Countries diversifying reserves away from the US dollar.
-
Sovereign debt risks – Growing concerns over debt sustainability in developed nations.
Technical Catalysts
-
A confirmed bottom at the 200-day moving average.
-
Momentum divergences signalling renewed buying.
-
Declining selling pressure from institutions.
Together, these factors point to a powerful bull market continuation.
Silver’s Potential to Outperform Gold
Silver often outpaces gold in bull markets due to its smaller market size and industrial demand. With strong demand from solar, EVs, and electronics, silver could realistically push towards $50+ during this cycle, with the silver-to-gold ratio narrowing sharply.
Key Levels for Investors to Watch
-
Support: 200-day MA, $3,000 psychological level, $2,070–$2,080 breakout zone.
-
Resistance: $2,450–$2,480 (previous high), $4,000, $5,000, and Fibonacci extensions.
These levels will be critical for identifying entry and exit points over the next two years.
Strategic Entry Point for Investors
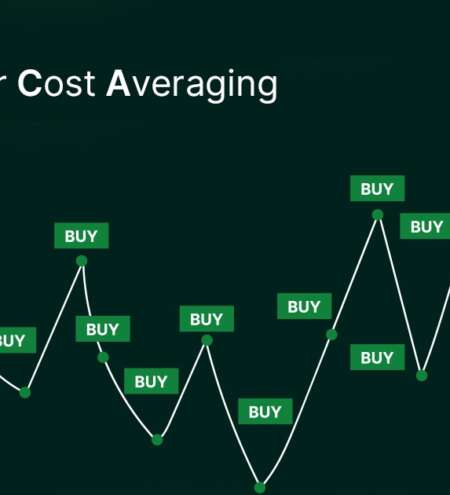
History shows the best time to enter gold is after corrections, not at initial breakouts. Investors may consider:
-
Building positions gradually near the 200-day moving average.
-
Watching for sentiment shifts and positive technical confirmation.
-
Positioning ahead of what could be a rapid surge in momentum once the correction ends.
Gold’s Next Major Bull Market Is Underway
Gold’s current correction should be seen not as weakness, but as healthy consolidation before a powerful continuation higher. With price targets between $5,000 and $6,000 by 2027, and silver poised to outperform, the next 24 months could represent one of the most rewarding opportunities for precious metal investors in decades.
At FirstGold, we believe this is a critical moment for strategic positioning. Investors who act during this correction phase may benefit most as the next leg of the gold bull market takes shape.
Note: The information provided is NOT financial advice. I am not a financial adviser, accountant or the like. This information is purely from my own due diligence and an expression of my thoughts, my opinions based on my personal experiences, and the way I transact.