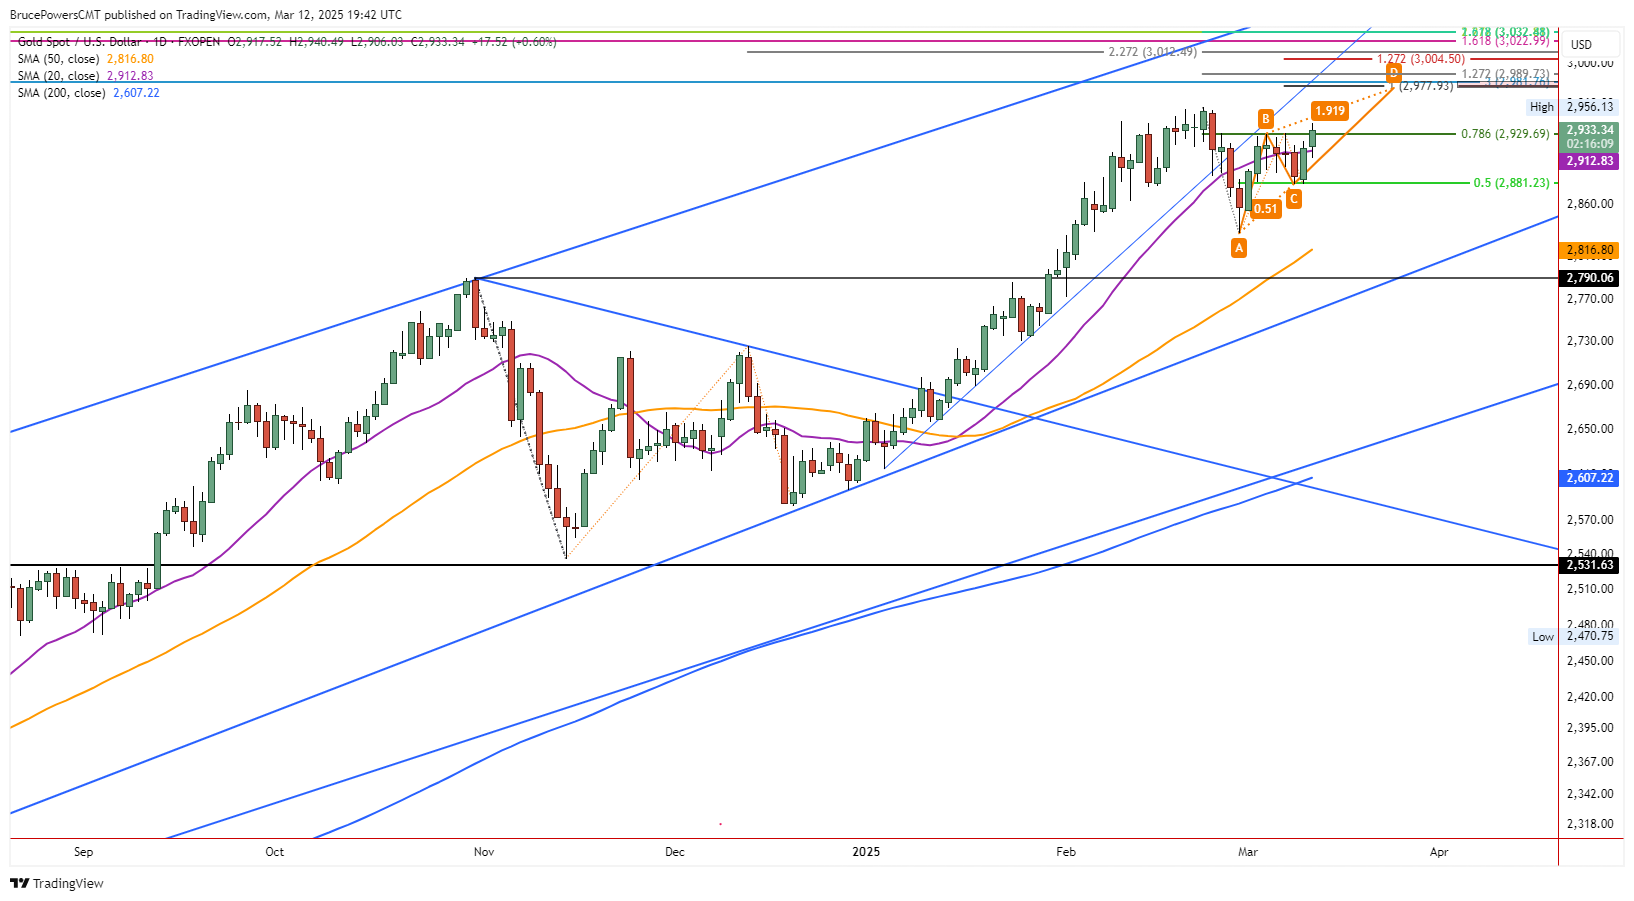
Gold retained its upward momentum on Wednesday and triggered a breakout above a lower swing high at $2,930. The advance also broke out above the 78.6% retracement level, also at $2,930, where gold had been stalled for about six days. Moreover, the 20-Day MA at $2,913 was reclaimed and tested as support with the day’s low of $2,906. This shows the progression of a strengthening trend.
The high for the day is $2,940, at the time of this writing and a daily close above that high will confirm the strength of the breakout. Currently, trading continues above that price level and in the upper third of the day’s trading range. This puts gold in a position to possibly close at the second or third highest daily closing price ever.
Experts trade the markets with IC Markets
Trading Derivatives carries a high level of risk to your capital and you should only trade with money you can afford to lose. Trading Derivatives may not be suitable for all investors, so please ensure that you fully understand the risks involved, and seek independent advice if necessary. A Product Disclosure Statement (PDS) can be obtained either from this website or on request from our offices and should be considered before entering into a transaction with us. Raw Spread accounts offer spread
A graph of stock market AI-generated content may be incorrect.
Potential Challenge to Record High of $2,956
The recent bearish retracement to a swing low of $2,833 and subsequent rally puts gold in a strong position to potentially break out to a new record high. A new record high of $2,956 was established in late February, putting it in sight of the current advance.
The first new high target at $2,978 is established by a rising ABCD pattern that looks for price symmetry between the two recent upswings. It can be considered along with another target close by at $2,982. The next higher target above that price zone is at the 127.2% Fibonacci extension of the recent bearish correction at $2,990.
Weekly Breakout Confirms Strength
It is also significant that today’s bull breakout triggered a weekly breakout above last week’s high, which took the form of an inside week. A daily close this week above last week’s high of $2,930 will confirm the breakout on the weekly time frame.
Bearish RSI Divergence a Concern
Despite the bullish indications noted above, there is a concern about a bearish divergence in the relative strength index (RSI). It shows diminishing bullish momentum. In addition, last month ended with a potentially bearish shooting star candlestick pattern. So far, trading in March has been contained inside the $2,772 to $2,956 price range from February. As gold approaches the peak of last month’s price range it is at risk of losing momentum before a new record high. Selling pressure indicated by the monthly shooting star candle pattern shows the potential for increased selling pressure as the $2,956 record high is approached.
Source: Fxempire