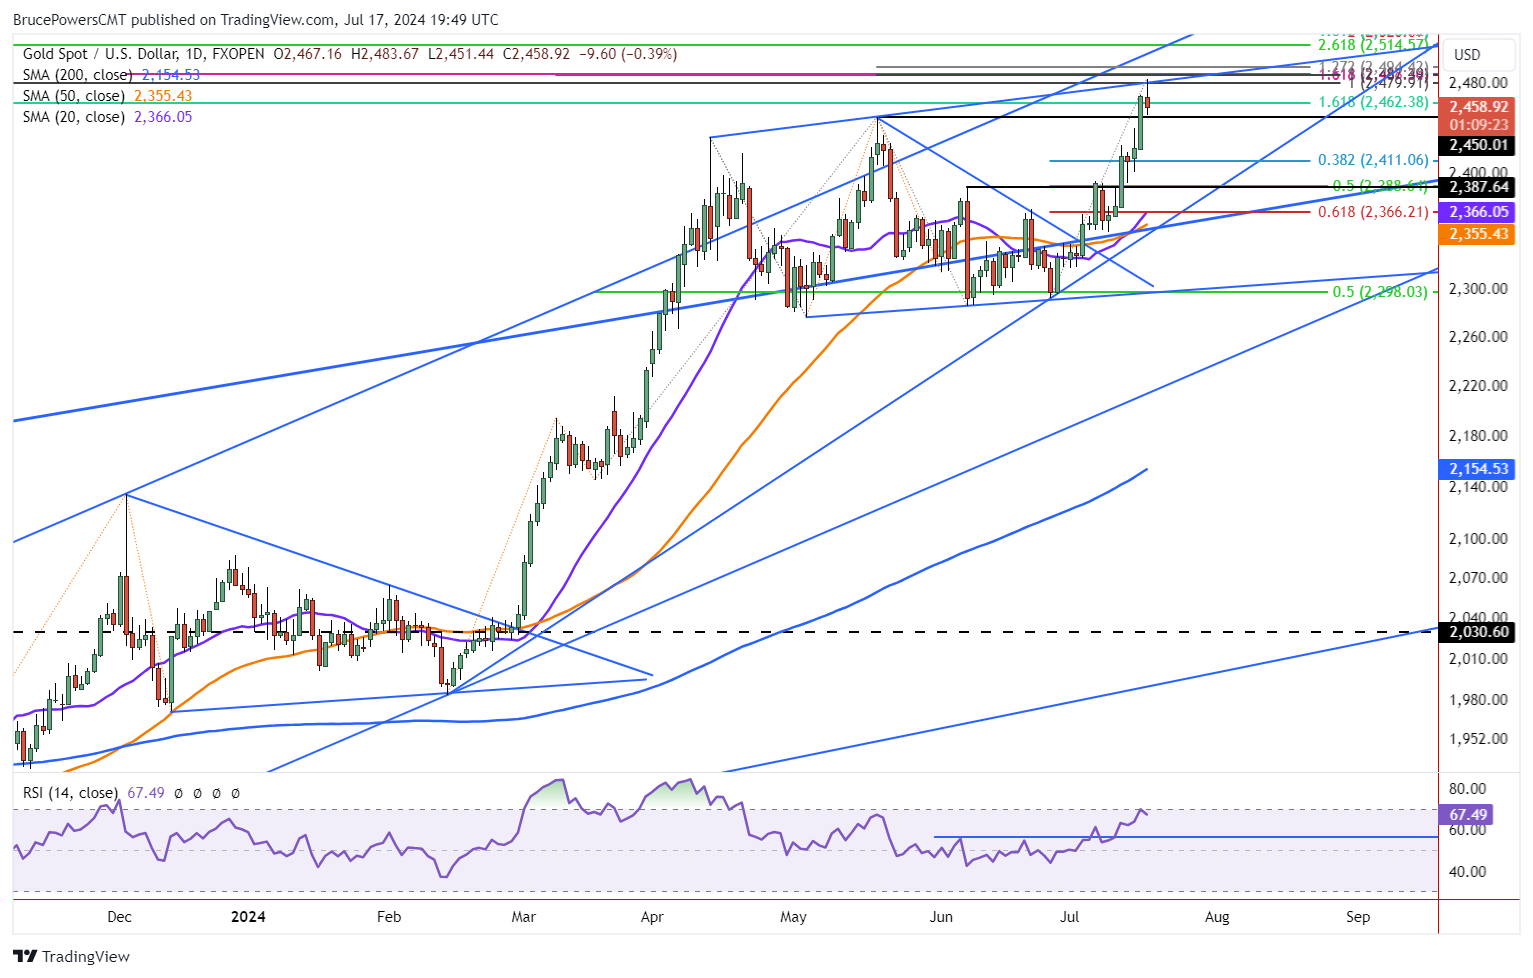
Gold continued to advance to a new trend high of 2,484 on Wednesday before encountering resistance. Sellers took back control from that high and have set gold up with a potential bearish shooting star candlestick pattern. Underlying strength remains however, as Wednesday is on track to complete a narrow range day near the highs of Tuesday’s new record high wide range breakout day. Strength indicated by the breakout was confirmed by Tuesday’s close above the previous record high of 2,450.
Experts trade the markets with IC Markets
High Completes ABCD Pattern Begun in 2018
There are a couple things to notice about today’s new record high. First, a target zone was hit on today’s advance at 2,480. That is a long-term target from a large ascending ABCD pattern that began from the August 2018 swing low. It began the AB leg of the advance. The second leg up, the CD portion, began from the September 2022 swing low. A potential pivot price is indicated once the price change in the second leg up matches the first. That is what is being seen so far.
It is confirmed by a short-term trendline connecting swing highs beginning with April 12. The high today was essentially a match with potential resistance indicated by the line. The ABCD pattern target is an initial target from the pattern. As gold continues to rise, extended targets will play a role. A 127.2% extended target for the ABCD is at 2,715.
Lower Support Starts with 2,411
If the bearish retracement from Wednesday’s high continues, it is triggered on a decline below today’s low of 2,451. A 38.2% Fibonacci retracement completes at 2,411, while this week’s low is at 2,401. Either marks an area of potential interest from buyers. Nevertheless, the 50% retracement level of 2,389 is confirmed by a prior interim swing high from early-June.
The 50-Day MA is a key trend support zone for gold. It is at 2,366 currently. Therefore, the bullish outlook is retained in gold if it stays above the 50-Day MA. Notice that recently the purple 20-Day MA crossed above the 50-Day line, proving another sign of strength for the precious metal.
Source: Fxempire

