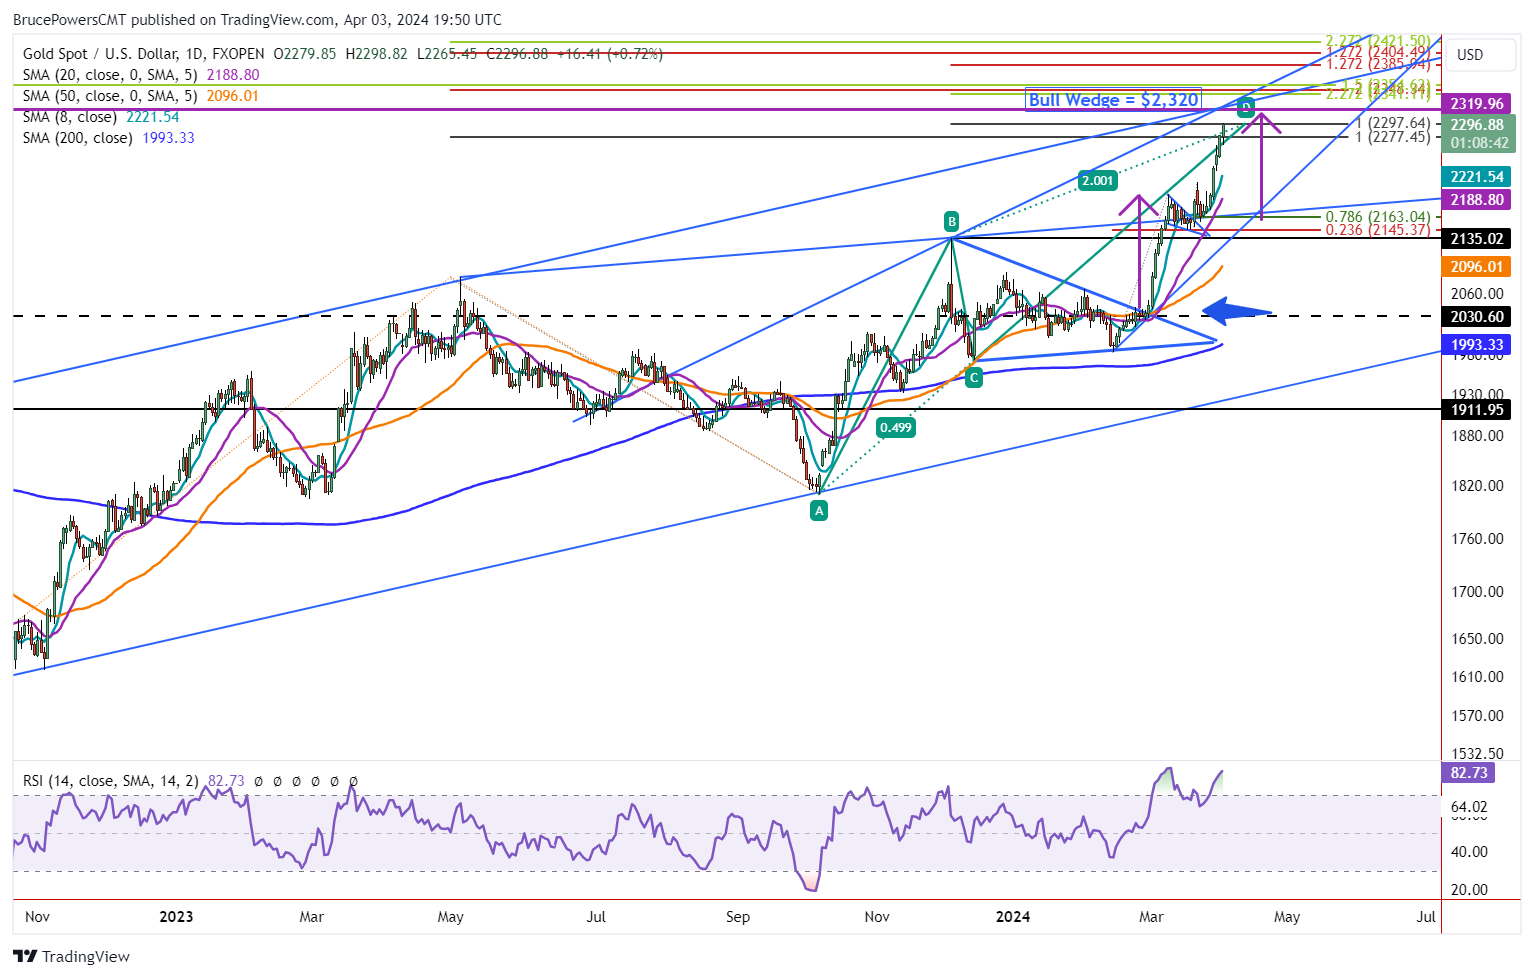
Gold’s surge to new highs continues, with prices hitting 2,299 and showing no signs of topping, targeting 2,320 next.
Gold’s advance remained strong on Wednesday as the precious metal exceeded the prior trend high to hit the next higher target of 2,298. The high of the day at the time of this writing was 2,299 and trading continues near the highs of the day. That target completes a large rising ABCD pattern that begins from the October swing low. It shows symmetry between the AB and CD legs of the pattern. Although that is a potentially significant pivot there are no signs that gold is ready to top.

A graph with lines and numbers Description automatically generated with medium confidence
Experts Trade Gold with IC Markets
Trading Derivatives carries a high level of risk to your capital and you should only trade with money you can afford to lose. Trading Derivatives may not be suitable for all investors, so please ensure that you fully understand the risks involved, and seek independent advice if necessary. A Product Disclosure Statement (PDS) can be obtained either from this website or on request from our offices and should be considered before entering into a transaction with us. Raw Spread accounts offer spread
Next Higher Target is 2,320
If gold does continue to advance above today’s high and through the 2,298-price zone the next higher target looks to be around 2,320. That price zone is identified as a target from the recent falling wedge. Once the breakout of the wedge triggered and was followed by rising prices, there is a chance that the first sharp rally that occurred before the wedge is matched following the breakout.
The sharp rally is considered to have begun on the breakout of the top trendline of a symmetrical triangle consolidation pattern. That was also when the price of natural gas began to move up and away from the 50-Day MA (orange).
Breakout of Multi-Year Base Confirmed
The strong rally and steady new record highs in gold seen following the breakout of the triangle confirms the breakout from a three-and-a-half-year base where gold essentially traded in a large sideways range. There had been several false breakouts since the initial 2,031 peak in 2020. This is the first where prices kept rising following the new record high. Last month ended with a new record monthly closing high and it provided confirmation of the base breakout.
Higher Targets Include 2,354 and 2,457
Gold is off to a good start on the breakout of the 3.5-year base. Above the 2,320 target is the 2,354-price zone, which completes a 150% extension of the retracement of the correction beginning from the 2011 high. Further up is the 161.8% extension of that decline at 2,457. That Fibonacci measurement covers the longest time frame of all the Fibonacci levels listed on the chart and therefore should be the more significant potential upside targets.
Source: Fxempire


