Spot Gold changed course in the American session, losing its early momentum and trading in the red in the $3,340.00 region. The bright metal gapped higher at the weekly opening, traded at around $3,375 before giving up to US Dollar (USD) renewed demand.
Risk off dictates market flow, with the dismal mood resulting from mounting trade concerns. Over the weekend, United States (US) President Donald Trump threatened tariffs of 30% on Mexico and the European Union amid the lack of progress in negotiations. Such tariffs should come into effect on August 1, according to the letters he sent to the respective governments.
Fears resurged after President Trump spoke about threatening to impose 100 tariffs on Russia if there’s no deal in 50 days, adding secondary sanctions on other countries that buy oil from Russia. Oil prices collapsed, fueling demand for the Greenback across the board.
Data-wise, investors will keep an eye on inflation updates, as the US, Canada and the United Kingdom will release updates in the next couple of days.
XAU/USD short-term technical outlook
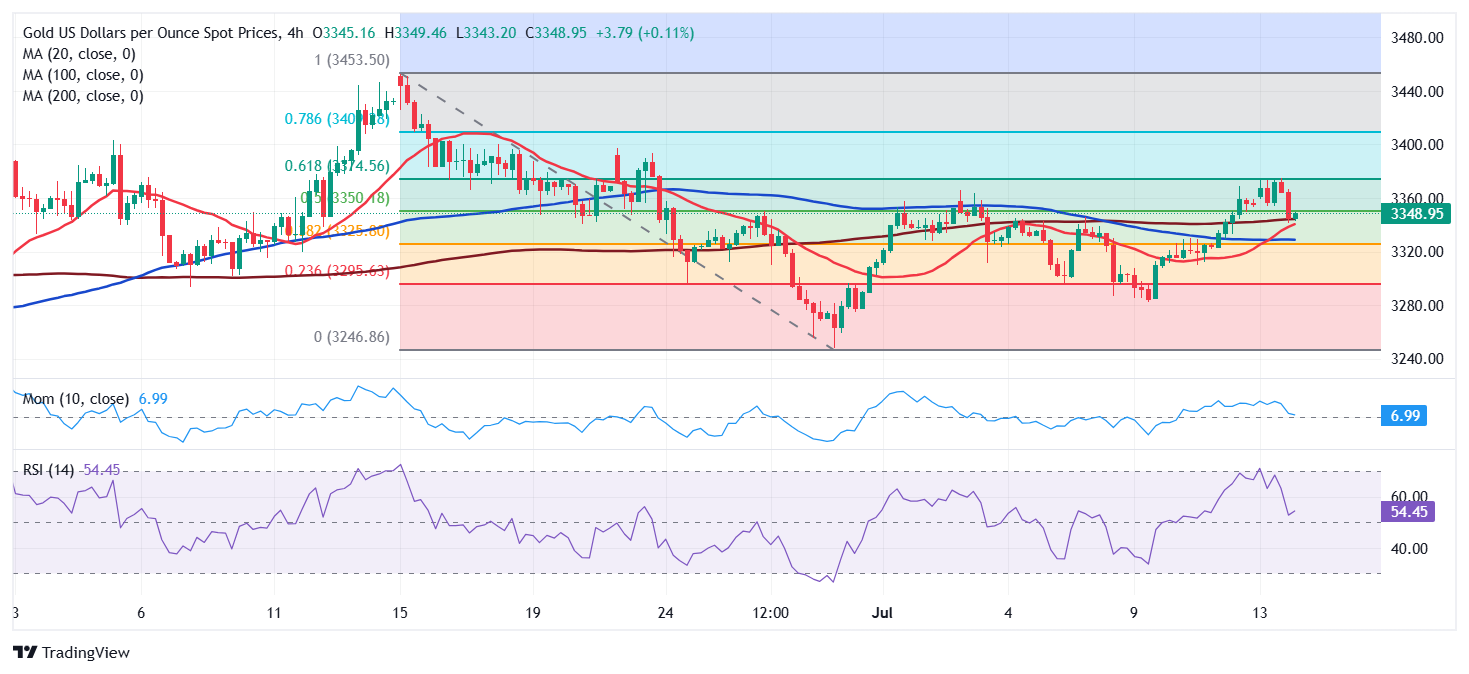
The daily chart for the XAU/USD pair shows it retreated sharply from the 61.8% Fibonacci retracement of the $3,452.51 – $3,247.83 decline at $3,374.56. The pair even extended its decline the 50% retracement at $3,350.18, now the immediate resistance level. The same chart shows the 20 Simple Moving Average (SMA) heads marginally lower just below the current level, while the 100 and 200 SMAs keep heading north below far below the shorter one. Finally, technical indicators hover around their midlines without clear directional strength.
In the near term, and according to the 4-hour chart, the case for additional slides seems limited. The XAU/USD pair is holding above all its moving averages, with a bullish 20 SMA extending its advance above a flat 100 SMA, but still below an also directionless 200 SMA. Technical indicators, in the meantime, pared their declines within positive levels, with the Momentum indicator ticking marginally higher.
Support levels: 3,325.00 3,311.70 3,295.50
Resistance levels: 3,350.18 3,374.56 3,390.10
Source: Fxstreet