The gold-to-silver ratio, a key metric in precious metals trading, has been observed for centuries as a measure of the relative value of gold and silver. It indicates how many ounces of silver are required to purchase one ounce of gold. Historically, this ratio has fluctuated significantly due to changes in monetary policies, economic conditions, and market demand for these metals.
Origins of the Gold-to-Silver Ratio
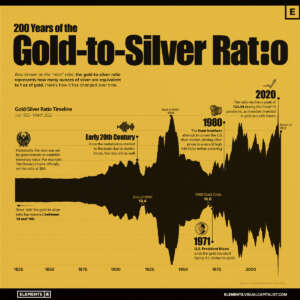
The gold-to-silver ratio has roots dating back to ancient civilizations. In the Roman Empire, the ratio was set at approximately 12:1, meaning one ounce of gold was equivalent to twelve ounces of silver. During the 18th and 19th centuries, many countries adhered to a bimetallic standard, where both gold and silver were used as legal tender. Under the U.S. Coinage Act of 1792, the ratio was set at 15:1, reflecting the market values of the time.
Fluctuations in the Modern Era
With the abandonment of the gold standard in the 20th century and the shift to fiat currency systems, the gold-to-silver ratio became more volatile.
1930s-1940s: During the Great Depression, the ratio spiked to 100:1 as gold prices remained relatively stable while silver prices plummeted.
1970s: The ratio fluctuated dramatically following the collapse of the Bretton Woods system. In 1980, during a peak in silver prices driven by the Hunt Brothers’ attempt to corner the silver market, the ratio dropped to around 16:1.
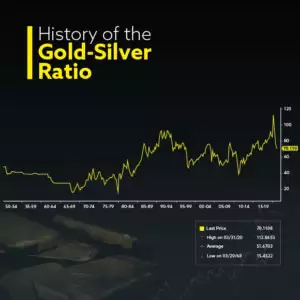
1990s-2000s: The ratio largely remained between 50:1 and 70:1, reflecting relatively stable market conditions.
2011: A notable dip in the ratio occurred when silver prices surged due to economic uncertainty, bringing the ratio close to 30:1.
2020-2024: The COVID-19 pandemic and geopolitical tensions caused extreme fluctuations, with the ratio hitting an all-time high of over 120:1 in March 2020 before settling into the 70:1 to 80:1 range.
What the Ratio Means for Investors
The gold-to-silver ratio is often used as a tool for market analysis. A high ratio (e.g., above 80:1) suggests that silver is undervalued relative to gold, potentially making it a strong buying opportunity. Conversely, a low ratio (e.g., below 40:1) may indicate that silver is overvalued relative to gold. Many investors use this ratio to decide when to shift holdings between gold and silver.
As of March 27, 2025, the gold-to-silver ratio stands at approximately 88.9, indicating that it takes about 89 ounces of silver to purchase one ounce of gold.
Silver Bullion
This elevated ratio suggests that silver is relatively undervalued compared to gold, potentially presenting a buying opportunity for investors interested in silver.
Future Outlook
As economic uncertainties persist, the gold-to-silver ratio is likely to remain a key indicator in precious metals trading. Factors such as inflation, central bank policies, and industrial demand for silver will continue to influence its fluctuations. While gold remains the preferred safe-haven asset, silver’s industrial applications may create opportunities for a lower ratio in the future.
Understanding the history of the gold-to-silver ratio helps investors make informed decisions about precious metals. Whether one sees it as a historical curiosity or a trading strategy, its significance in the financial world remains undeniable.
Which is the Better Investment?
For long-term stability and wealth preservation: Gold is the better choice.
For higher risk-reward potential, especially at a high gold-to-silver ratio: Silver may offer greater upside.
Given the current high ratio (89:1), history suggests that silver could outperform gold in the long run as the ratio tends to revert to lower levels. However, gold remains the safer asset for preserving value during economic instability.