Gold is back in focus after a sharp bounce last week, fueled by intensifying geopolitical tensions and renewed demand for safe-haven assets—setting the stage for a potential retest of record highs.
Gold Rebounds After Pullback, Support Holds Firm
Following an impressive rally that lifted it to a record high of $3,500 per ounce in April 2025, gold (XAU/USD) entered a brief consolidation phase. This pause in momentum was largely driven by a more optimistic global backdrop, including improved U.S.–China relations and President Donald Trump’s decision to postpone additional trade tariffs.
Risk-on sentiment returned to markets, pushing capital into equities and away from traditional safe-haven assets like gold. As a result, prices retraced modestly. However, this pullback found solid footing at key technical support zones, particularly the 20-day and 50-day simple moving averages—levels that have consistently acted as launchpads for bullish reversals.
Geopolitical Tensions Fuel Safe-Haven Bid
Last week, that narrative shifted sharply. The escalation of military conflict between Israel and Iran rattled global markets, as Israeli airstrikes reportedly killed senior Iranian officials and civilians. Iran’s retaliatory missile strikes added fuel to the fire, driving investor anxiety and reigniting demand for gold as a store of value.
Gold surged back above the $3,400 mark, ending the week at $3,434. The renewed momentum signals that the retreat may be over, and a second attempt to breach the $3,500 high is increasingly likely. Market sentiment has turned defensive, with investors reallocating capital in anticipation of further instability in the Middle East.
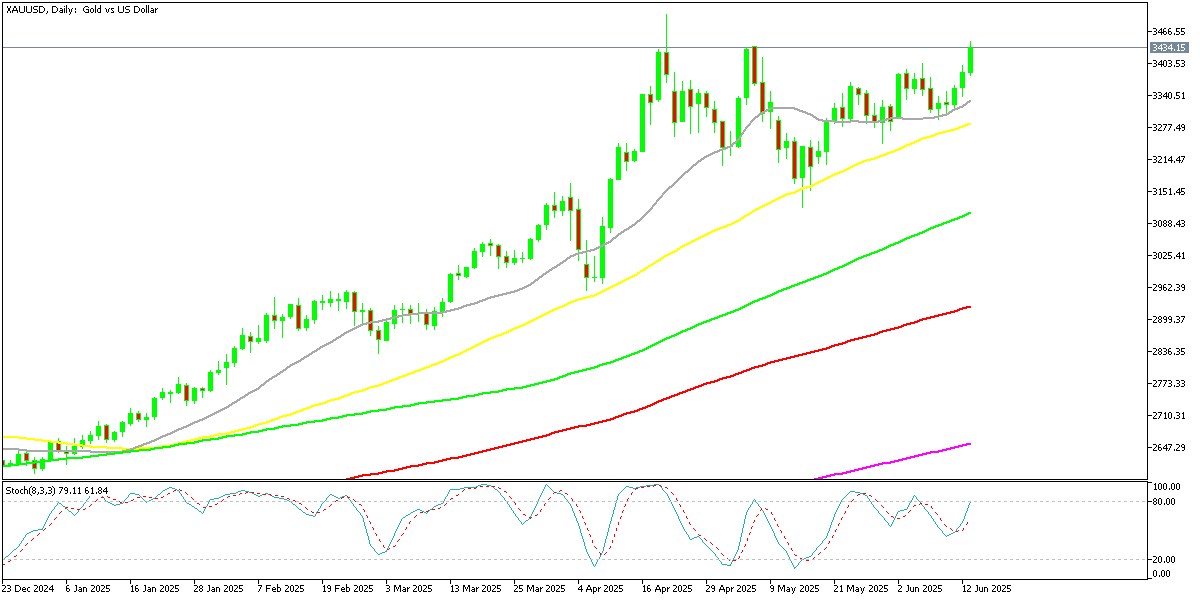
Gold Chart Daily – Technical Structure Remains ConstructiveChart XAUUSD, D1, 2025.06.15 20:02 UTC, MetaQuotes Ltd., MetaTrader 5, Demo
Despite recent volatility, gold’s technical landscape remains bullish. The daily chart shows the 20-day SMA (gray) and 50-day SMA (yellow) providing consistent support throughout the year. Last week’s sharp rebound from the 20 SMA reinforces the bullish structure and supports the idea of another leg higher.
Momentum indicators are turning upward, and if prices hold above $3,400 in early trading this week, it may trigger fresh breakout buying—particularly if geopolitical tensions persist.
Conclusion: Path of Least Resistance May Be Up
Gold remains one of the few assets that benefits from global fear, and with rising uncertainty in geopolitics and shaky risk sentiment in equities, its appeal has returned in force. The combination of solid technical support, macro-driven fear, and historical momentum suggests that another test—and possible break—of the $3,500 level may be just around the corner.
Source: Fxleaders

