Physical vs Paper Pricing, Fiat Expansion, and the Gold Relationship (1970–2026 + Outlook)
Executive Summary
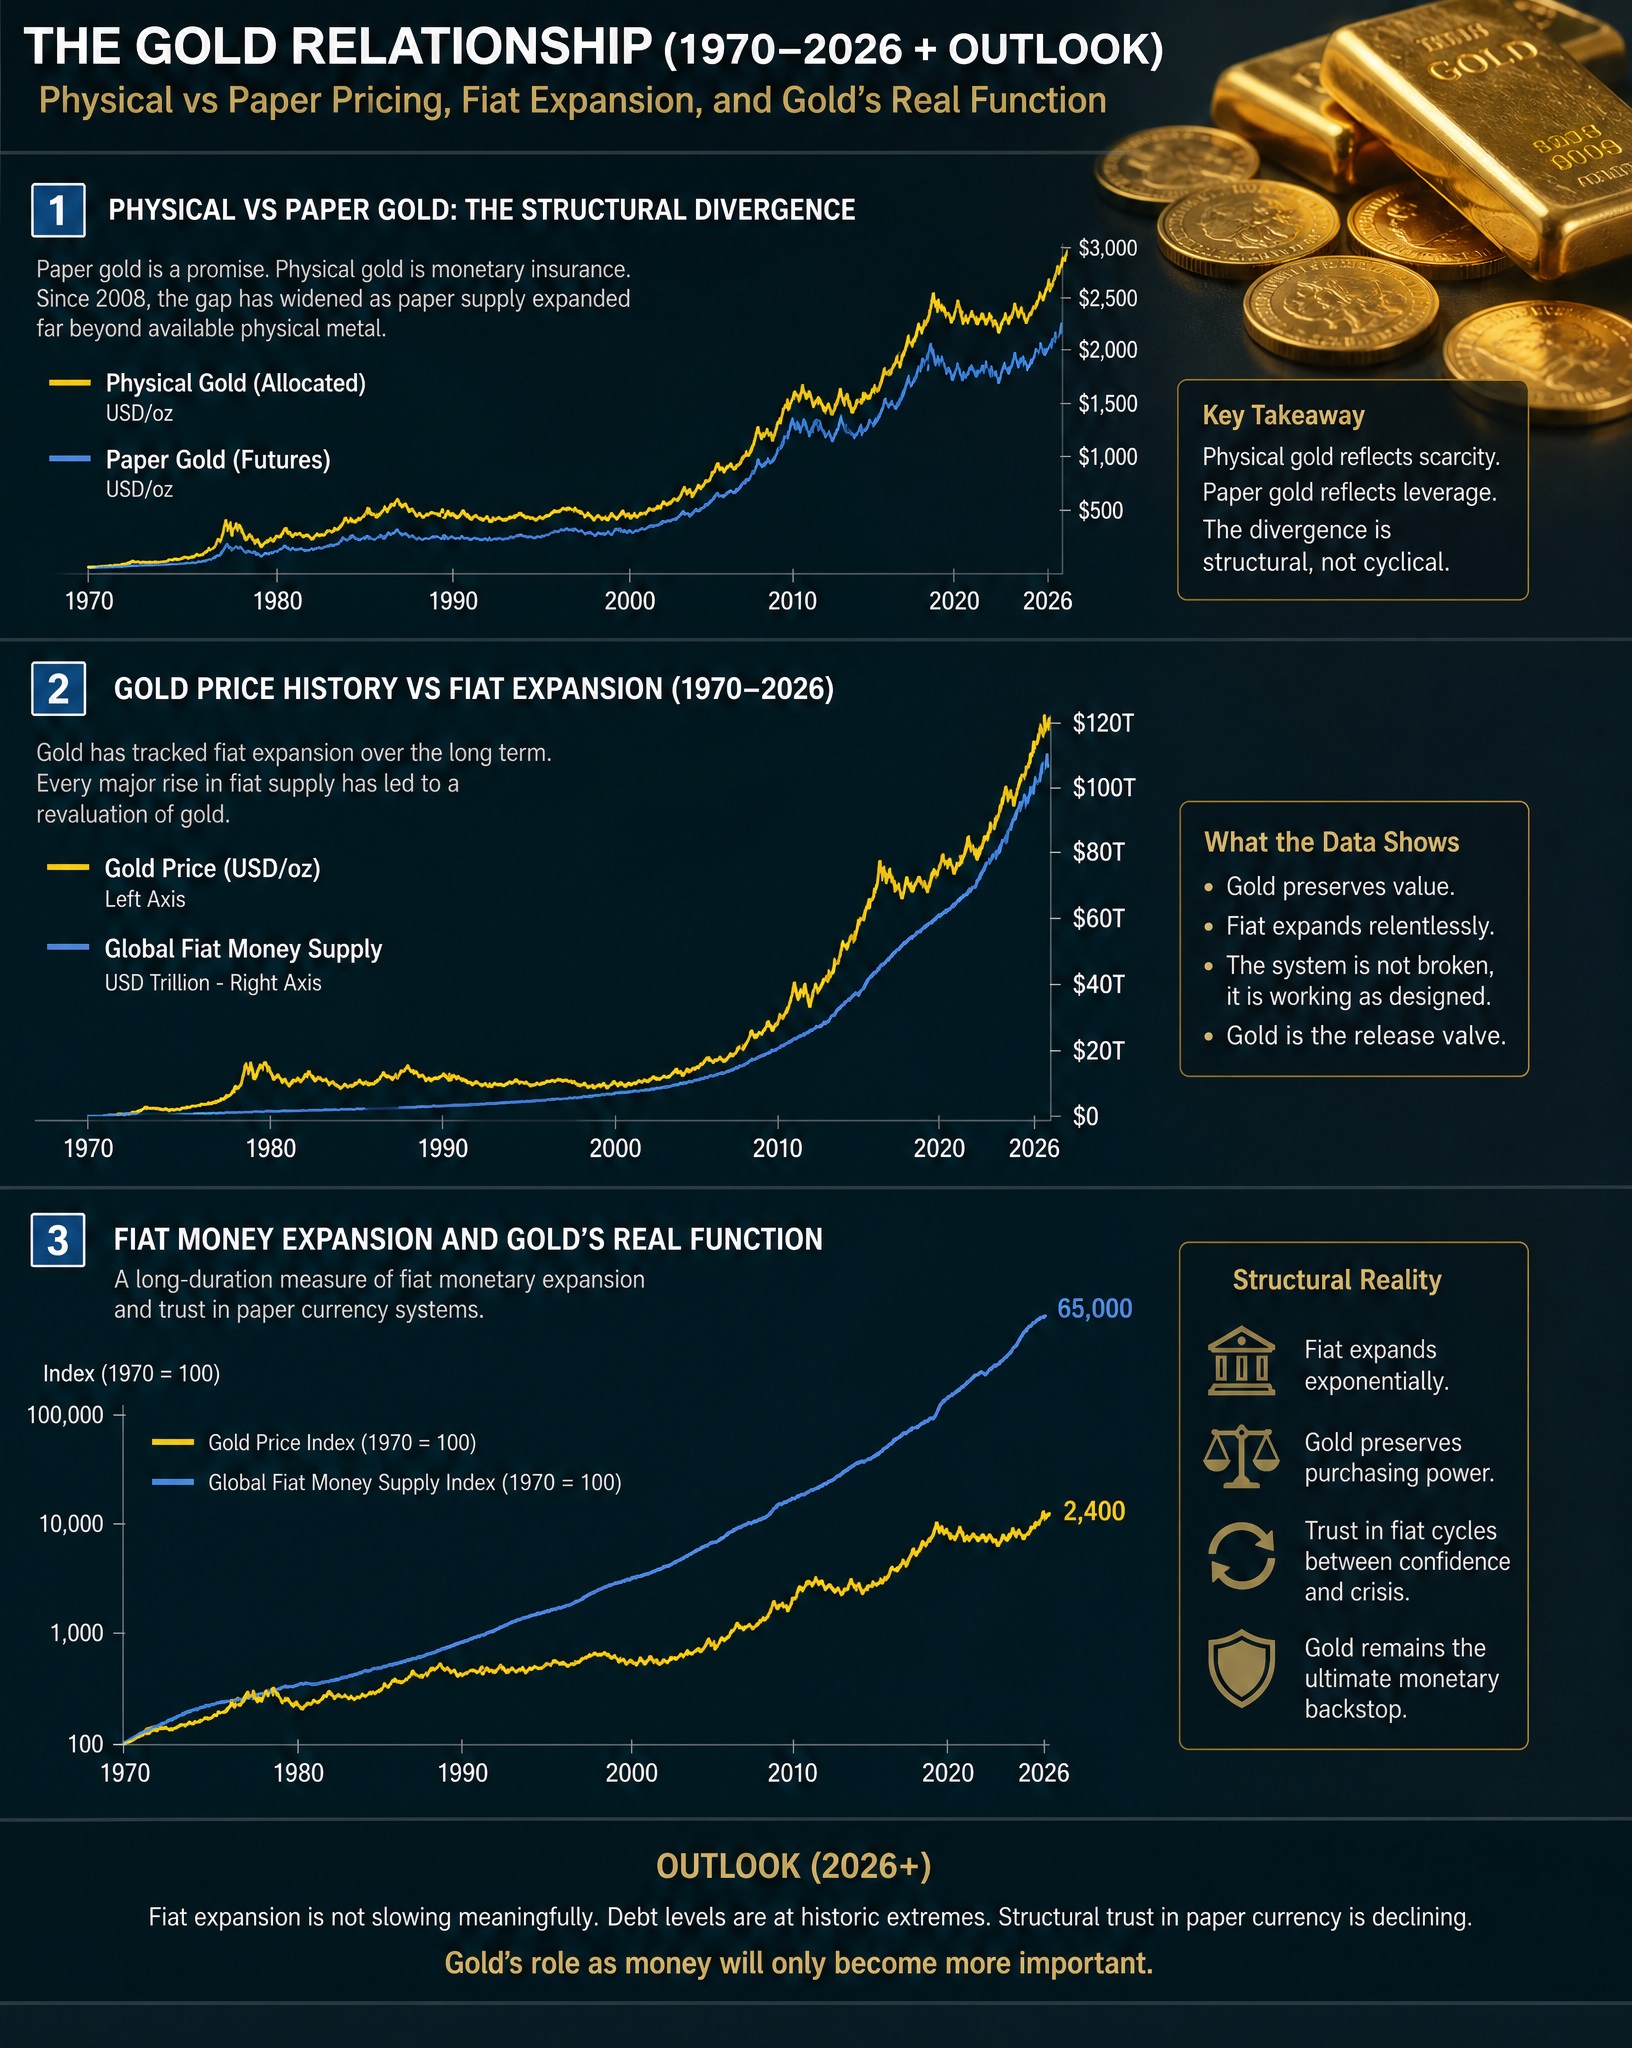
Since the collapse of the Bretton Woods system in the early 1970s, gold has transitioned from a formally anchored monetary asset into a globally traded financial insurance instrument. Over this period:
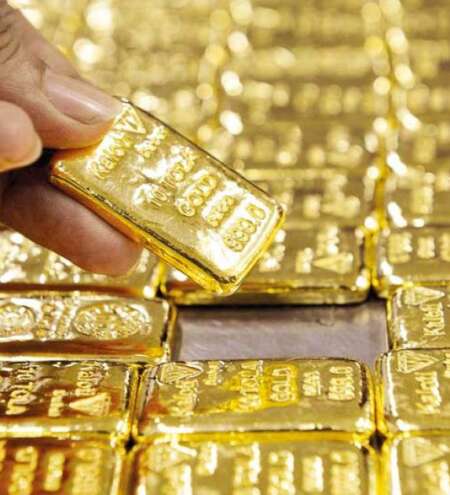
- Gold has risen from ~$35/oz (1971) to over $4,000/oz (2025–2026 range)
- US broad money supply (M2) has expanded by more than 20x–25x over the same period
- Paper gold markets (futures, ETFs, derivatives) have grown far larger than physical deliverable supply
- The result is a widening gap between:
- Physical gold scarcity pricing
- Paper gold liquidity pricing
Academic work confirms a long-run linkage between gold and money supply expansion, while showing weaker short-term correlation due to liquidity cycles and financialisation effects
1. Physical vs Paper Gold: The Structural Divergence
The key shift since 1970
In 1971, the US closed the gold window. From that moment:
- Gold stopped being money
- Gold became a freely floating monetary substitute
- Paper claims on gold (futures, unallocated accounts, ETFs) expanded rapidly
Two-tier pricing system emerged
Physical gold price drivers
- Central bank accumulation
- Jewellery demand
- Bar and coin investment demand
- Geopolitical risk
- Supply rigidity (1.5–2% annual mine growth)
Paper gold price drivers
- Futures positioning (COMEX/LBMA)
- Interest rates and real yields
- Dollar liquidity conditions
- Derivatives leverage cycles
The structural outcome
- Physical gold behaves like a monetary asset
- Paper gold behaves like a liquidity proxy
This creates periodic dislocations where:
- Paper price is suppressed during liquidity expansion phases
- Physical premiums rise during stress or delivery strain
2. Gold Price History vs Fiat Expansion (1970–2026)
Key price milestones
Interpretation
Three major regimes are visible:
1. 1970–1980: Monetary shock phase
- End of gold peg
- Inflation surge
- Gold reprices violently upward
2. 1980–2000: Fiat confidence expansion
- High interest rates suppress gold
- Strong dollar regime
- Financial asset boom (equities outperform)
3. 2000–present: Debt monetisation phase
- Persistent deficit expansion
- Central bank balance sheet growth
- Gradual but accelerating gold repricing
3. Fiat Money Expansion and Gold’s Real Function
Core structural relationship
Across multiple empirical studies, gold shows:
- Weak short-term correlation with money supply changes
- Strong long-term cointegration with monetary expansion trends
- Money supply increases tend to lead gold price increases with a lag of months to years
What this means in practice
Gold is not reacting to:
- Monthly inflation prints
- Short-term interest rate changes
Gold is responding to:
- Long-term purchasing power dilution of fiat currency
4. The Hidden Mechanism: Why Gold Tracks Money Creation
Step 1: Money supply expands
- Credit creation increases
- Central bank balance sheets grow
- Government debt rises
Step 2: Financial assets absorb liquidity first
- Stocks
- Bonds
- Real estate
Step 3: Lagged transmission into gold
- Gold reacts last
- But adjusts more permanently
Step 4: Monetary reset mechanism
Gold acts as:
- A store of residual monetary trust
- A hedge against long-term currency debasement
5. The Paper-to-Physical Disconnect
A defining feature of the modern system is leverage:
- Vast multiples of paper claims exist per ounce of physical gold
- Only a small fraction is intended for delivery
- Most contracts settle financially, not physically
Resulting structural effects:
- Price discovery is increasingly liquidity-driven
- Physical demand shocks create asymmetric upward spikes
- Downside moves are often paper-liquidation events
This is why gold can:
- Stay suppressed for years
- Then reprice rapidly in short bursts
6. Interpretation: What Has Actually Happened Since 1970
The real story is not gold rising
It is:
The gradual devaluation of fiat purchasing power measured in gold terms
Key structural shifts:
- Gold is relatively stable in real scarcity terms
- Fiat currencies continuously expand in supply
- Financial systems increasingly rely on leverage over physical settlement
So the correct framing is:
- Gold is not “going up”
- Fiat is buying less gold over time
7. 10-Year Forecast (2026–2036)
We model three scenarios based on monetary expansion, debt trajectory, and central bank policy behaviour.
Scenario A: Controlled Liquidity (Base Case)
- Moderate money supply growth
- Higher real interest rates stabilise inflation
- Continued central bank gold accumulation
Gold range:
- $4,000 → $7,000/oz
Scenario B: Debt Monetisation Cycle (High Probability Trend Path)
- Persistent fiscal deficits
- Yield curve control dynamics
- Continued global de-dollarisation pressures
Gold range:
- $4,000 → $10,000/oz
Scenario C: Monetary Confidence Break (Tail Risk)
- Sovereign debt stress
- Rapid fiat credibility erosion
- Physical gold demand surge
Gold range:
- $10,000 → $20,000+/oz (non-linear repricing)
8. Key Drivers for the Next Decade
Bullish structural forces
- Global debt exceeding sustainable thresholds
- Central bank diversification into gold
- Energy and geopolitical fragmentation
- Persistent fiscal deficits
Suppressive forces
- Real interest rate spikes
- Strong USD liquidity cycles
- Periodic financial deleveraging
Conclusion
Since 1970, gold has not simply been a commodity market. It has functioned as:
A long-duration measure of fiat monetary expansion and trust in paper currency systems
The widening gap between physical and paper markets reflects a deeper reality: the financial system has become increasingly dependent on leverage and liquidity rather than settlement in real assets.
Over the next decade, the dominant variable is unlikely to be gold supply.
It is likely to be:
The speed and scale of fiat expansion relative to real economic output
Gold, in that context, remains the system’s most persistent external reference point for monetary value.
Sources: econpapers, gold.org, .researchgate, gold-eagle, .sciencedirect, repec, nber, econstor, goldpriceforecast