Gold’s recent retreat could be short-lived as bullish patterns emerge. A falling wedge and Fibonacci analysis suggest a potential rally towards new record highs above 2,195.
Gold enters its seventh day of a pullback following the new record high of 2,195 hit last week. Nevertheless, the retracement so far has been mild indicating remaining buying pressure for the precious metal. Yesterday gold completed a minor 23.6% Fibonacci retracement with a low of 2,146. That ratio is not used as frequently in Fibonacci analysis as deeper retracements that lead to reversals in the direction of the prevailing trend occur more frequently. Bullish reversals from earlier Fibonacci levels show stronger demand than bullish reversals that follow deeper retracements.
 Experts Trade Gold with IC Markets
Trading Derivatives carries a high level of risk to your capital and you should only trade with money you can afford to lose. Trading Derivatives may not be suitable for all investors, so please ensure that you fully understand the risks involved, and seek independent advice if necessary. A Product Disclosure Statement (PDS) can be obtained either from this website or on request from our offices and should be considered before entering into a transaction with us. Raw Spread accounts offer spread
Support Seen at Minimum 23.6% Fibonacci Level
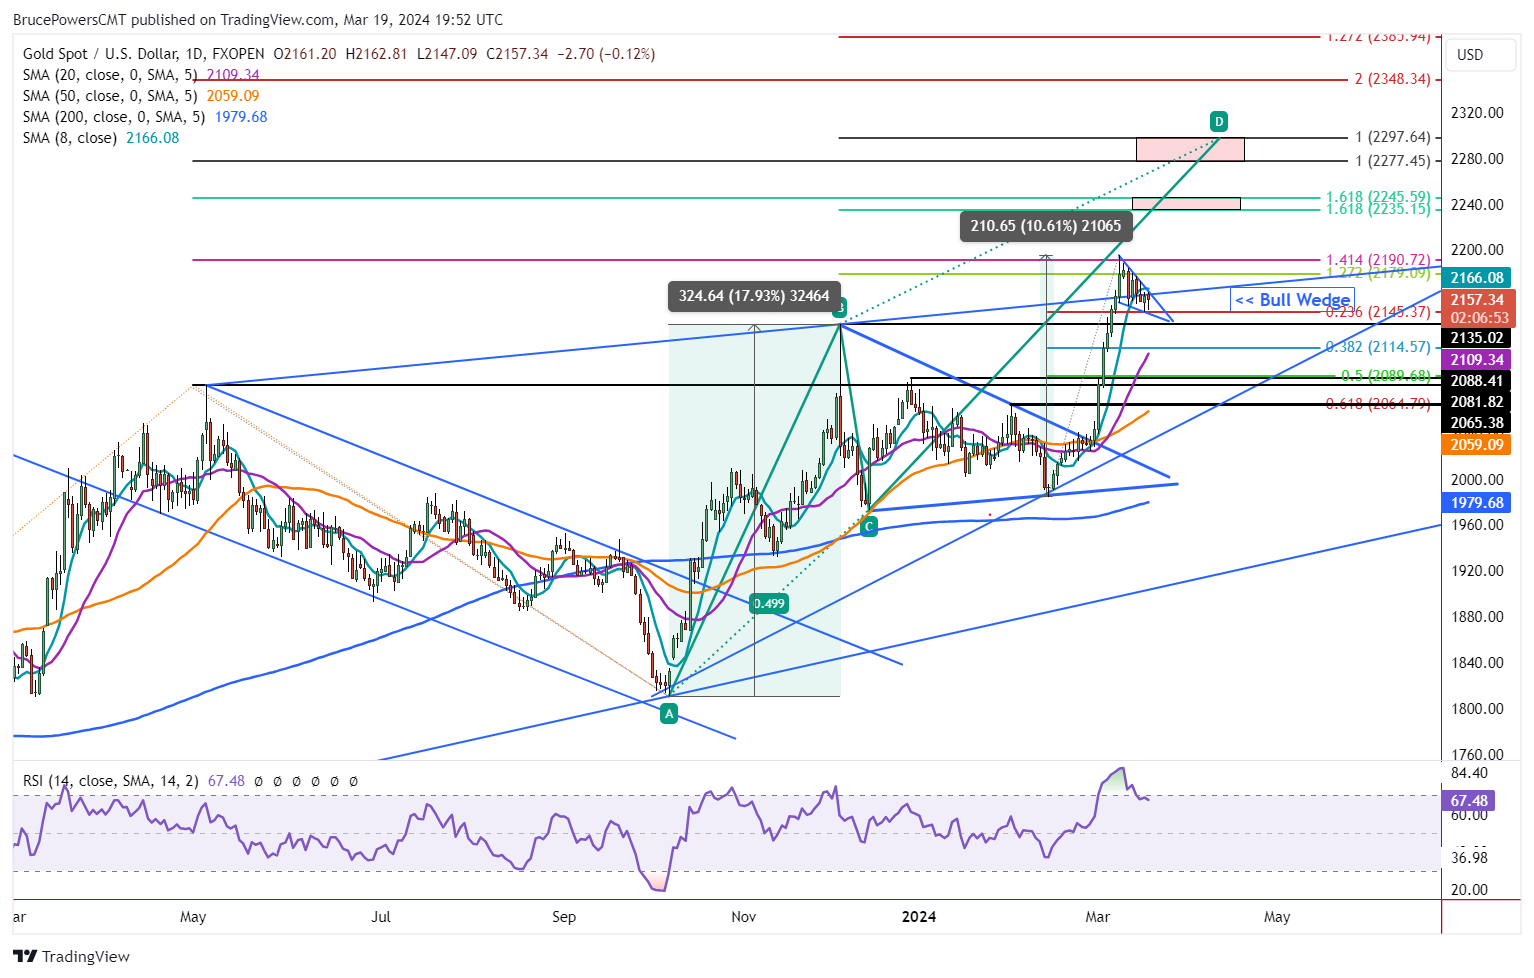
Support around the 23.6% retracement was tested successfully again today leading to an intraday bounce. Gold is on track to complete Tuesday with an inside day. Although the market has not yet closed at the time of this writing, it is looking like a bullish hammer candlestick may complete. If so, an upside breakout above today’s high of 2,163 shows strength, while a breakout above yesterday’s high of 2,164 offers greater confidence that the advance may be sustainable.
Bullish Falling Wedge Forms
Upon further investigation of recent price action, a small falling bullish wedge comes into view. It is a trend continuation pattern. Although the wedge may still need more time to form, or it can morph into a different pattern, a rise above yesterday’s 2,164 high triggers an upside breakout. That could be the beginning of the next move that takes gold above the 2,195-record high. Further signs of strength will then be needed, starting with a rally above the four-day high of 2,177. A Fibonacci target zone is up at 2,235 to 2,246, followed by a higher price zone from 2,277 to 2,298.
We can assess the wedge like a bull pennant by taking the previous sharp advance from before the wedge formed and then adding that distance to the breakout area to arrive at an approximate target. The low from March 1 is being used in this analysis for the bottom of the pole. It provides a potential target of 2,320.
Combined Analysis Points to 2,298 to 2,340 Target Zone
Also, a rising ABCD pattern, discussed previously and shown on the chart, targets 2,298. The measured move advance prior to the early-December previous record high (B) was 325 points or 17.9%. A similar move for the current advance would put gold at 2,309 when looking at the price difference. Calculated on a percentage basis, the target would be around 2,340. In summary, the analysis in this paragraph points to a target zone from approximately 2,298 to 2,340.
Source: Fxempire

