The gold market has surged to new record levels in 2024. The most significant movement occurred in Q3 2024, where the quarterly candle was the largest among all the year’s quarters. Geopolitical uncertainty and Fed rate cuts ahead of the US presidential election have weakened the US dollar, which are the primary factors behind this strong rally. This article presents the technical analysis of the gold market and the recent catalysts to understand price behavior and project the gold price movement in the final quarter of 2024.
Bullish Trends Push Gold Near to Projected Price Targets
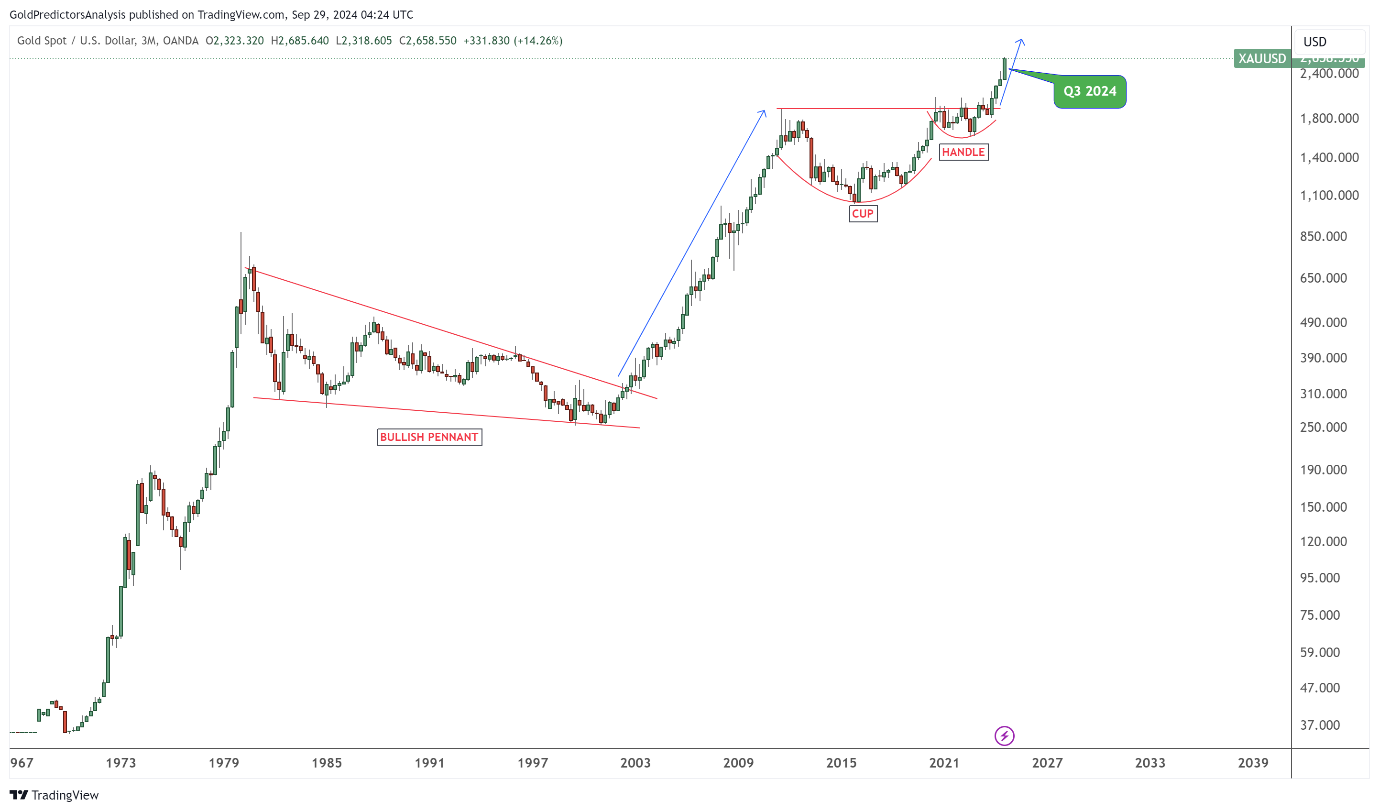
The long-term chart shows a strong bullish momentum for the gold market, as illustrated in the quarterly chart below. It is observed that the price broke out of the bullish pennant in 2003 after consolidating within this pattern for nearly two decades. This breakout drove gold prices to hit record highs in 2011. Following this, gold prices entered a strong consolidation phase below the yearly pivot of $2,075. This yearly pivot was eventually broken to the upside after forming a cup-and-handle pattern below it. Interestingly, this yearly pivot became the neckline of the cup-and-handle formation.
Experts trade the markets with IC Markets
The cup-and-handle pattern and the breakout above $2,075 have propelled gold prices to record levels, reaching an all-time high of $2,685 in Q3 2024. The year 2024 has been marked by strong quarterly candles, with the third quarter being the largest of the year. The chart also reveals that the initial breakout began in the last quarter of 2023, marking the start of this surge. The strong quarterly performance and the strong third-quarter close at record levels suggest that the last quarter of 2024 is likely to be interesting.
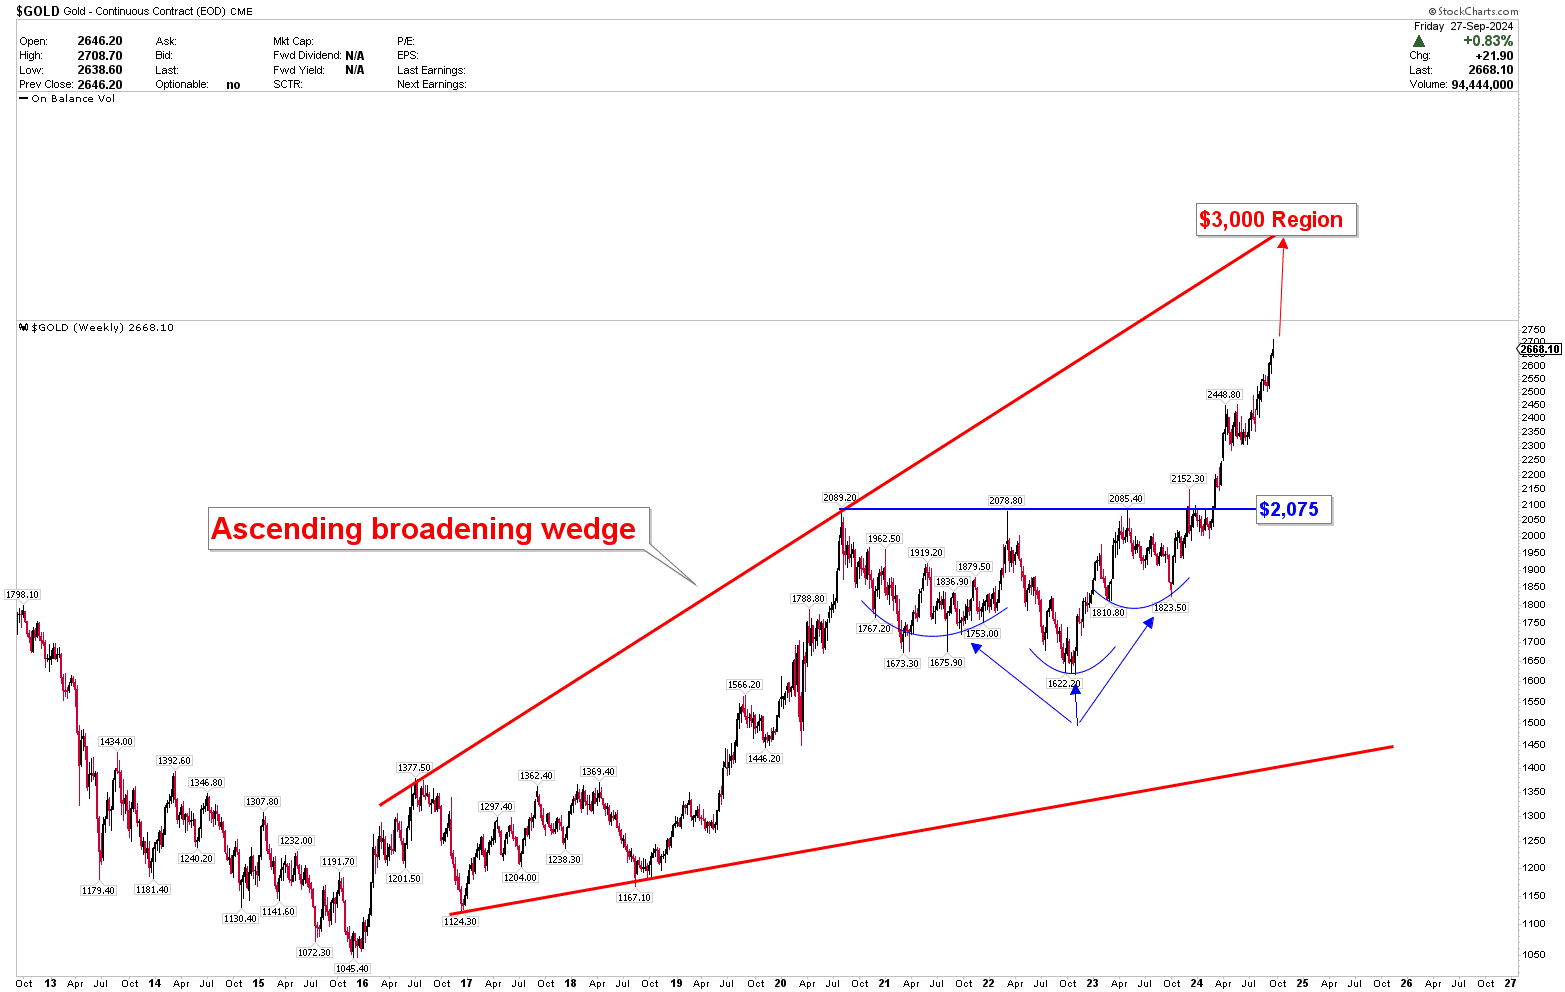
To understand the price projection of the gold market in the last quarter of 2024, the weekly chart below illustrates the formation of an ascending broadening wedge pattern, which has formed an inverted head-and-shoulders pattern, highlighted in blue. This inverted head-and-shoulders pattern has a neckline at $2,075, which has been confirmed as the yearly pivot. The breakout above this level initiated a strong surge in gold prices, with the target of this surge estimated to be around $3,000, calculated by extending the ascending broadening wedge line.
Since the third quarter showed significant price gains, the next quarter of 2024 is likely to remain strong. However, the price is approaching a seasonal correction period, where a potential price pullback in October or November could provide the next buying opportunity for traders in 2025.
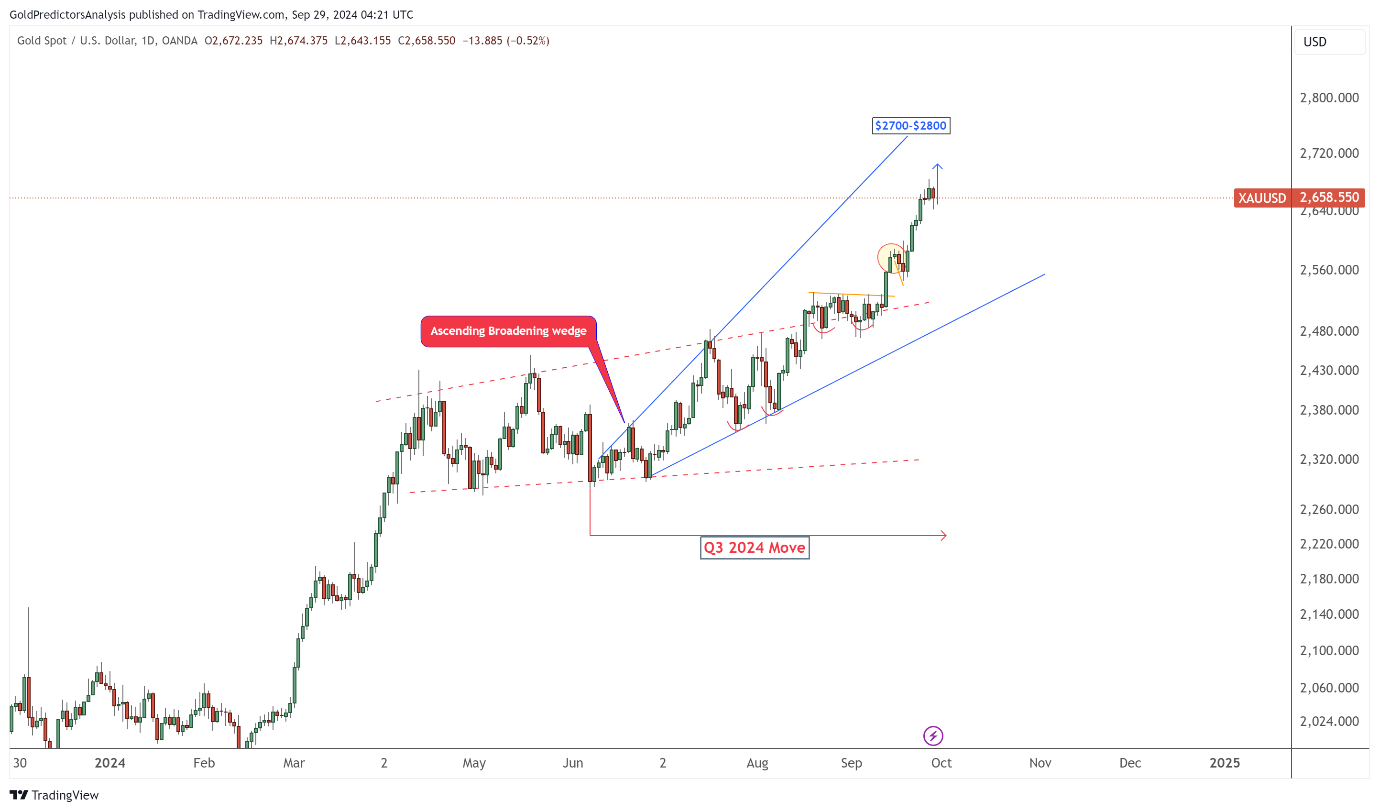
The daily chart below also shows a similar trend approaching near-term resistance. This near-term resistance is measured using the short-term ascending broadening wedge. This wedge targets the levels of $2,700-$2,800 in October. However, as time progresses, this wedge line is increasing at a rate of approximately $100 per month. The chart below shows that the Q3 2024 price movements have been strongly upward. The price bottomed at the red dotted trend line, which is also forming another ascending broadening wedge. The intersection of these wedges marked the bottom of the third quarter of 2024. As the price movements are strongly upward, gold is currently within the last phase of a surge, and therefore, price volatility may increase in the short to medium term. This volatility may help achieve the price objectives within the $2,700-$3,000 range. Once this objective is met, a sharp and quick move may follow, providing long-term investors an opportunity to enter the gold market.
Gold Price Projection for Q4 2024
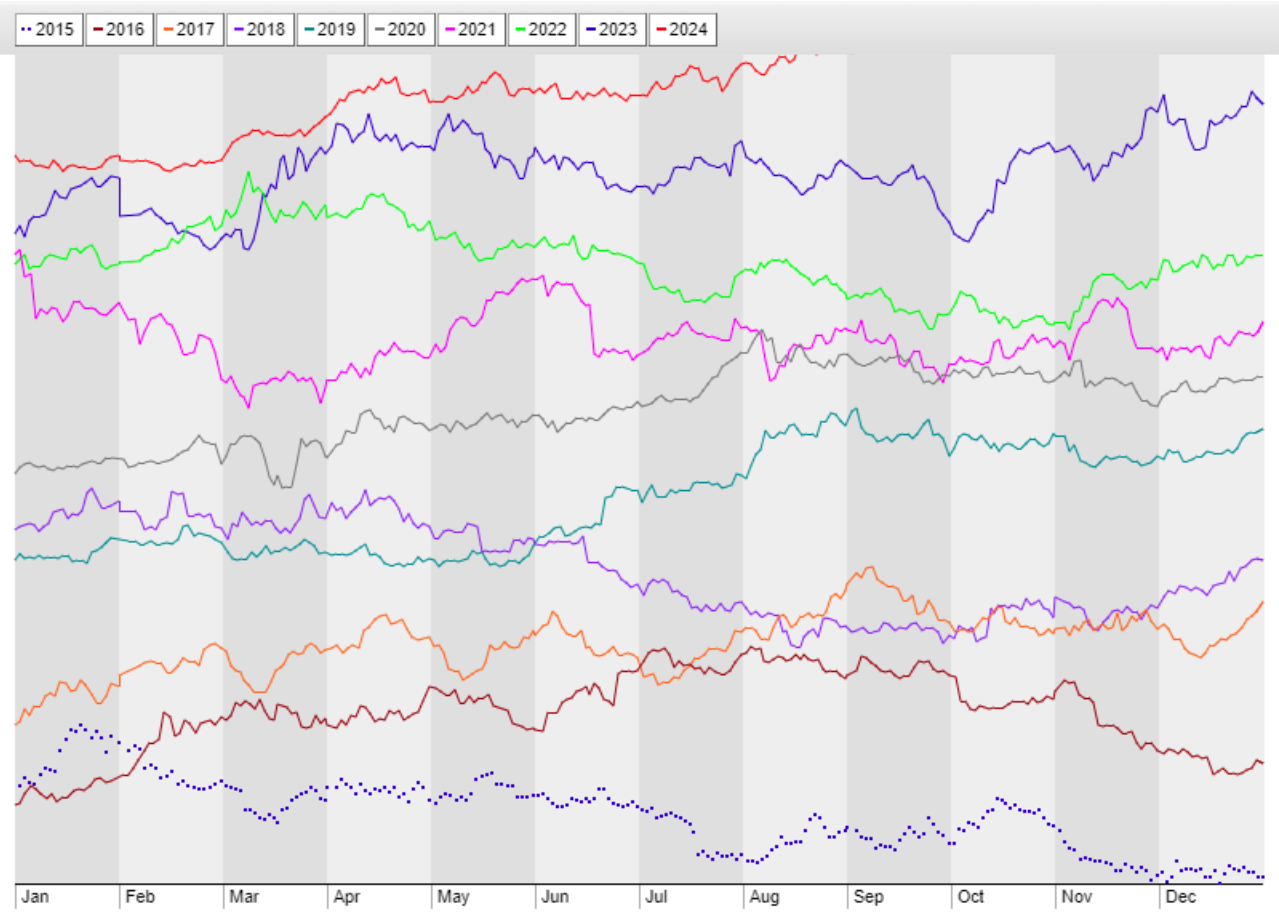
As discussed above, the gold market is trending higher and shows strong price gains during the third quarter of 2024. The seasonal chart below shows the price data for the past 10 years. It is found that October is usually either a price peak or consolidation month. The chart shows that 2023 and 2015 were the years when the gold market experienced significant price gains in October. However, all other years of the past decade exhibited price consolidation within ranges. Another interesting observation is that September has been strong in 2024. Therefore, it is highly likely that if the gold objectives of $2,700-$3,000 are achieved in October, there might be a sharp and quick price correction in October or November, followed by a strong December.
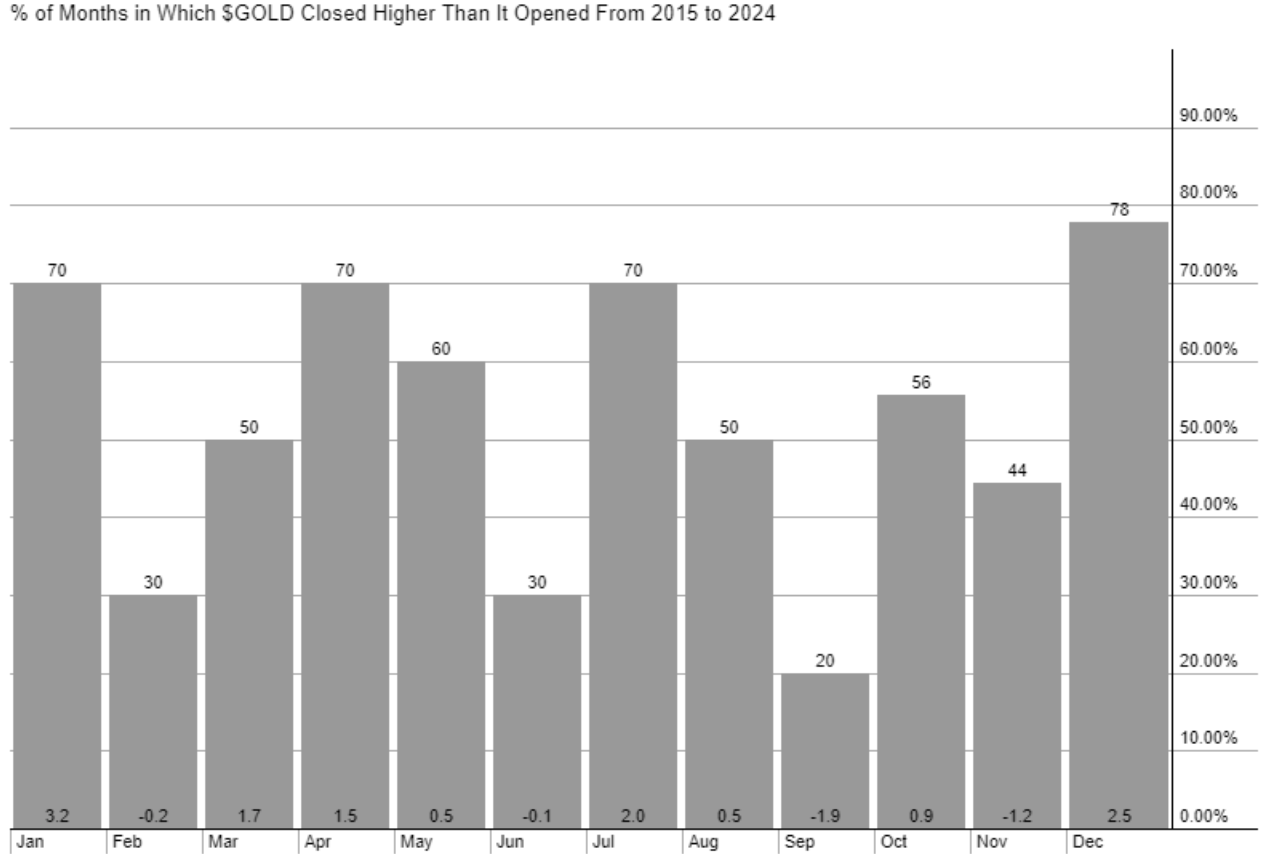
The chart below shows the percentage of months gold has closed higher than it opened over the past decade. It is observed that October has a 56% probability of closing above its opening price. However, the price chart typically shows a pattern of consolidation. Since September 2024 was strong, the likelihood of a strong price gain in the first half of October, followed by a price correction, may present a risk during Q4 2024. Therefore, a correction is likely in the final quarter of 2024, either in October or November, but this price correction may lead to a strong price gain in December 2024 and into the following year.
Key Catalyst for Gold Surge in Q4 2024
The recent rally in gold has been driven by several key catalysts that have bolstered the metal’s appeal to investors. Firstly, expectations of further interest rate reductions by the Fed have played a significant role. With the Fed having already delivered a 50 bps cut in September 2024, the market anticipates additional easing, potentially up to 75 bps more by year-end. This dovish monetary policy stance weakens the yield on traditional assets like bonds, making non-yielding gold a more attractive investment. Furthermore, these rate cuts signal a softening economic outlook, which typically fuels demand for safe-haven assets.
In addition to monetary policy, geopolitical concerns support the gold rally. The ongoing conflict between Russia and Ukraine, coupled with recent escalations in the Middle East between Israel and Hamas, has heightened global uncertainty. Such geopolitical risks drive investors towards safe-haven assets, as gold is traditionally a hedge against geopolitical instability and economic turmoil. This “flight-to-safety” behavior will likely persist if these geopolitical tensions remain unresolved, providing a robust foundation for gold’s upward momentum.
The decline of the US dollar has also been a pivotal factor in supporting the gold rally. Since late June, the USD has been weakening, posting consecutive weekly losses as the Fed’s dovish outlook diminishes its allure. A weaker USD makes gold, priced in dollars, more affordable for buyers using other currencies, thereby boosting demand. As long as the Fed continues to lean towards rate cuts and the USD remains under pressure, the current bullish gold trend will likely persist. However, given the metal’s recent surge, a short-term pullback may be necessary to avoid an overbought scenario.
Moreover, the prospect of gold hitting the price objective of the $3,000 level is likely if expectations of continued Fed easing hold. The persistent geopolitical instability and a dovish Fed signal prolonged lower interest rates, but the fundamental drivers for gold remain strong. Investors should be mindful of potential volatility, but the broader trend still points to a bullish outlook for the yellow metal in the foreseeable future.
Source: Fxempire


