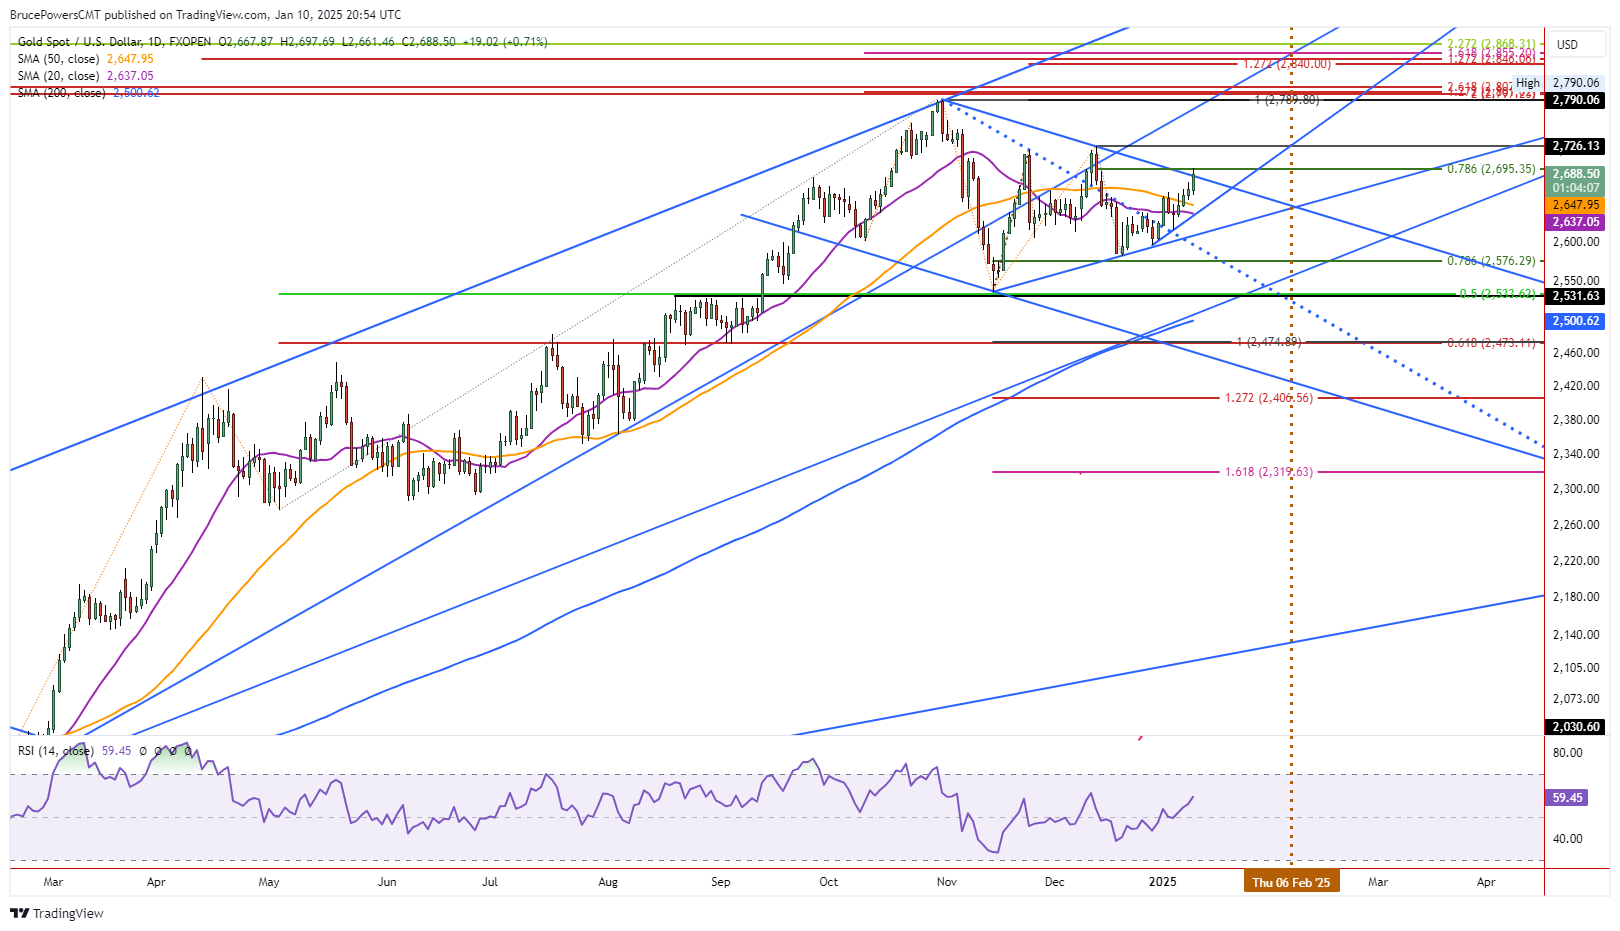
Gold busted above a short trendline on Friday to reach a high for the day and new high for that trend at 2,698. The advance completed a 78.6% retracement at 2,695, which is just above the trendline. Now, the question is whether gold can continue to strengthen to a new trend high or whether selling pressure stops the ascent and turns gold back down for either a retracement or consolidation.
Experts trade the markets with IC Markets
Trading Derivatives carries a high level of risk to your capital and you should only trade with money you can afford to lose. Trading Derivatives may not be suitable for all investors, so please ensure that you fully understand the risks involved, and seek independent advice if necessary. A Product Disclosure Statement (PDS) can be obtained either from this website or on request from our offices and should be considered before entering into a transaction with us. Raw Spread accounts offer spread
Trendline Breakout
It looks like the trendline is being recognized by the market as gold is currently set to close at or near resistance at the line. That is the top boundary line for a declining trend channel. Although today’s high was above the line, the trend needs further signs of strength to indicate it might go higher in the short term. A subsequent breakout above 2,698 will not only signal a continuation of the near-term trend, but also provide a second breakout signal from the falling channel.
Bullish Weekly Pattern
The long-term weekly chart (not shown) is bullish as gold broke out to a three-week high this week and is set to have its highest weekly closing price in seven weeks. In addition, the week is set to end strong, with gold likely closing in the top third of the week’s price range. This is a sign of strength that could be a precursor to continued strengthening.
Reaches Key Pivot Area at Top of Channel
Today’s low of 2,661 is short-term support, while the 50-Day MA is at 2,649 and the 20-Day MA sits at 2,637. Potential support around the recent interim swing low of 2,615 has significance as it is a higher swing low. But it is not as significant as support at the swing low of 2,596 from late last year, given its location in the price pattern. Since the 2,615-swing low gold has risen for four days.
However, the previous rally from the November swing low at 2,537 peaked after five days. It remains possible that time symmetry will be seen with the current advance hitting another new high for the trend before stalling. That would complete a series of five consecutive days of higher daily highs and higher lows.
Source: Fxempire

